Overview:
This article provides a comprehensive analysis of the United Arab Emirates’ (UAE) economic landscape from 2011 to 2025, offering valuable insights into key indicators shaping the country’s growth.
It covers the UAE’s Gross Domestic Product (GDP) evolution, sector contributions to GDP, Consumer Price Index (CPI) trends, interest rate movements, trade balance performance, foreign exchange reserves, and foreign direct investment (FDI) inflows.
In addition, the article highlights the UAE’s demographic profile, including population growth trends and an overview of the UAE’s population pyramid, offering a complete picture of the country’s economic and social dynamics.
If you require customized research or more detailed insights tailored to your needs, feel free to contact Optimena — we’re here to support your business decisions.
UAE Economic Outlook:
UAE Gross domestic product (GDP) 2011-2025 (Billion $)
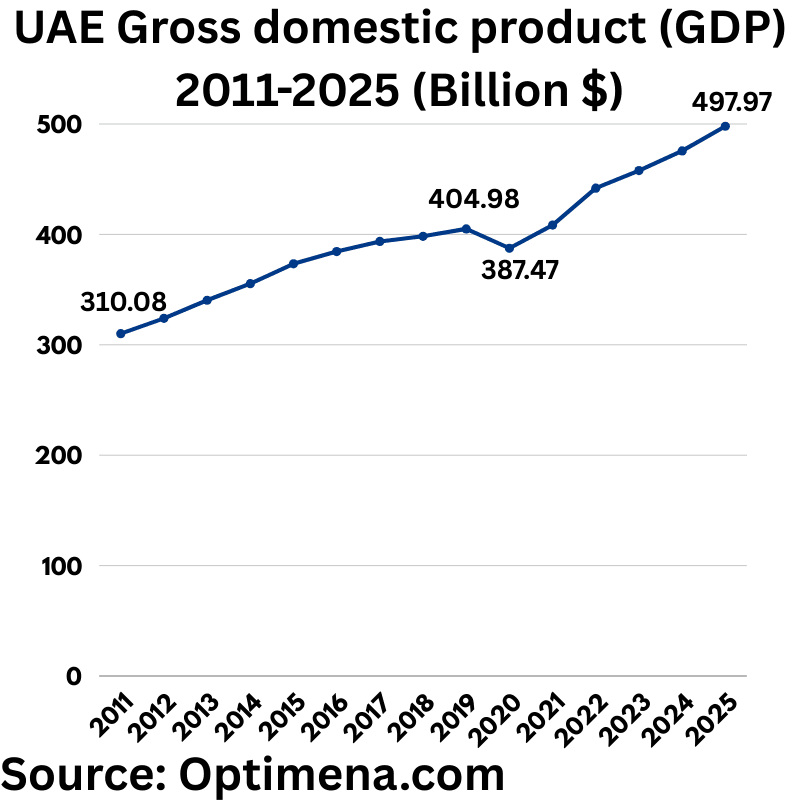
– **2011**: $310.08 billion
– **2012**: $323.98 billion
– **2013**: $340.35 billion
– **2014**: $355.36 billion
– **2015**: $373.34 billion
– **2016**: $384.48 billion
– **2017**: $393.61 billion
– **2018**: $398.29 billion
– **2019**: $404.98 billion
– **2020**: $387.47 billion
– **2021**: $408.45 billion
– **2022**: $441.86 billion
– **2023**: $457.77 billion
– **2024**: $475.62 billion
– **2025**: $497.97 billion
The United Arab Emirates (UAE) GDP has shown consistent growth over the past decade, reflecting the country’s economic resilience, diversification efforts, and investment in infrastructure, tourism, and renewable energy. Below is a year-by-year overview of the UAE’s GDP from 2011 to 2025, in billion USD:
From **2011 to 2019**, the UAE’s GDP steadily increased from $310.08 billion to $404.98 billion. In **2020**, the GDP declined to $387.47 billion due to the global COVID-19 pandemic and reduced oil demand. However, the country bounced back quickly, reaching $408.45 billion in **2021** and continuing its upward trend in subsequent years.
The **UAE GDP in 2022** reached $441.86 billion, followed by **$457.77 billion in 2023**. Estimates suggest a rise to **$475.62 billion in 2024**, with a **projected GDP of $497.97 billion in 2025**. This growth highlights the success of Vision 2030 strategies, diversification from oil, and increased foreign investments.
Contribution of economic activities to UAE GDP
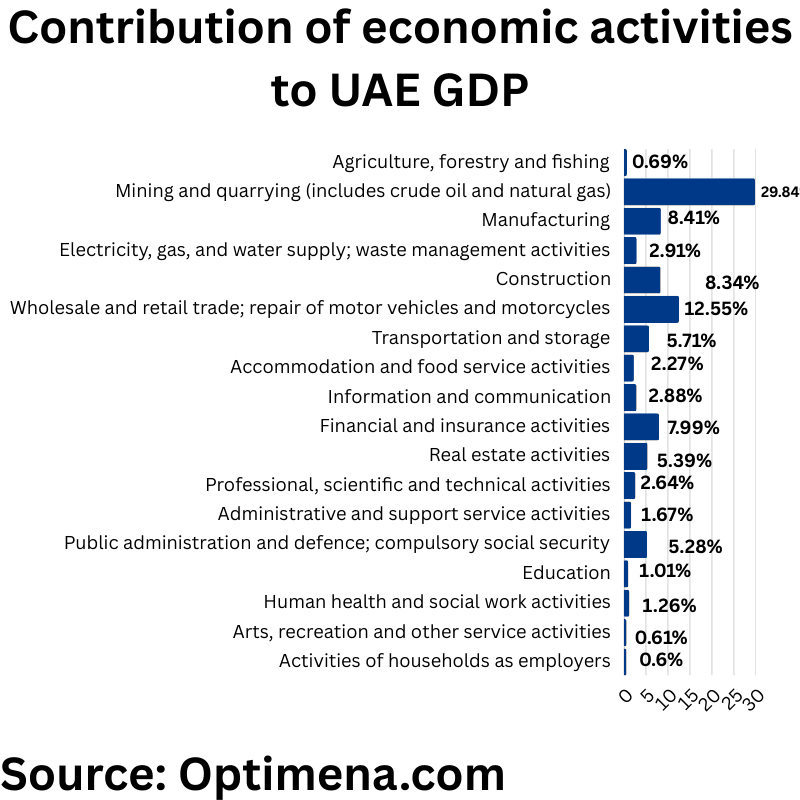
The UAE’s GDP structure remains heavily reliant on **mining and quarrying activities (29.84%)**, largely driven by the oil and gas sector, reinforcing the economy’s continued, though gradually diversifying, dependence on hydrocarbons. **Wholesale and retail trade (12.55%)** and **manufacturing (8.41%)** are the strongest non-oil contributors, reflecting robust internal demand and ongoing industrial development policies.
**Construction (8.34%)** continues to play a pivotal role, fueled by large infrastructure projects and real estate investments. The strong performance of **financial and insurance activities (7.99%)** and **real estate activities (5.39%)** highlights the UAE’s evolution as a global business and investment hub. Meanwhile, sectors like **transportation and storage (5.71%)** and **public administration (5.28%)** indicate significant government involvement in economic activity and the importance of logistics and connectivity.
Relatively modest contributions from **agriculture (0.69%)**, **education (1.01%)**, and **healthcare (1.26%)** align with the UAE’s arid climate and the still-developing local services sector. However, rising investments in **information and communication (2.88%)** and **professional services (2.64%)** suggest a clear strategic shift toward a more knowledge-based and digital economy in the long term.
UAE Consumer Price Index (CPI) 2011-2025
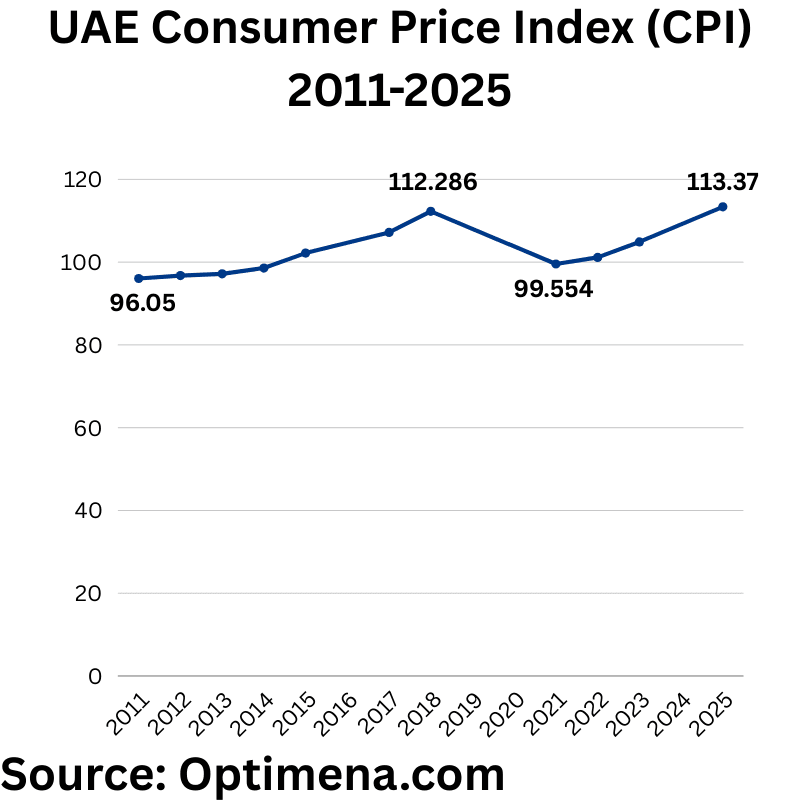
Base year: 2014
2011 96.05
2012 96.75
2013 97.17
2014 98.58
2015 102.19
2016 104.8
2017 107.19
2018 112.286
2019 109.607
2020 108.142
2021 99.554
2022 101.151
2023 104.884
2024 107.287
2025 113.37
The UAE’s Consumer Price Index (CPI) shows **moderate inflation trends** over the period 2011–2025. Between 2011 and 2017, the CPI steadily rose from **96.05 to 107.19**, reflecting **gradual economic growth** and **cost-of-living increases** linked to strong infrastructure development and consumer demand.
In **2018**, a noticeable spike to **112.29** occurred, largely influenced by the introduction of **VAT (Value Added Tax)** at 5%, which temporarily pushed prices upward. Following this, the CPI softened slightly through **2019 and 2020** as global economic pressures, including lower oil prices and the onset of the **COVID-19 pandemic**, dampened inflationary pressures.
A sharp decline in **2021** to **99.55** reflects **deflationary effects** from pandemic-related slowdowns. However, the index rebounded from **2022 onwards**, reaching an estimated **113.37 in 2025**, supported by **economic recovery**, **rising global commodity prices**, and **higher domestic consumption**, in line with the UAE’s post-pandemic growth strategies and diversification efforts.
Overall, the CPI trend mirrors the UAE’s **resilient yet adaptive economy**, navigating external shocks while maintaining a generally controlled inflation environment.
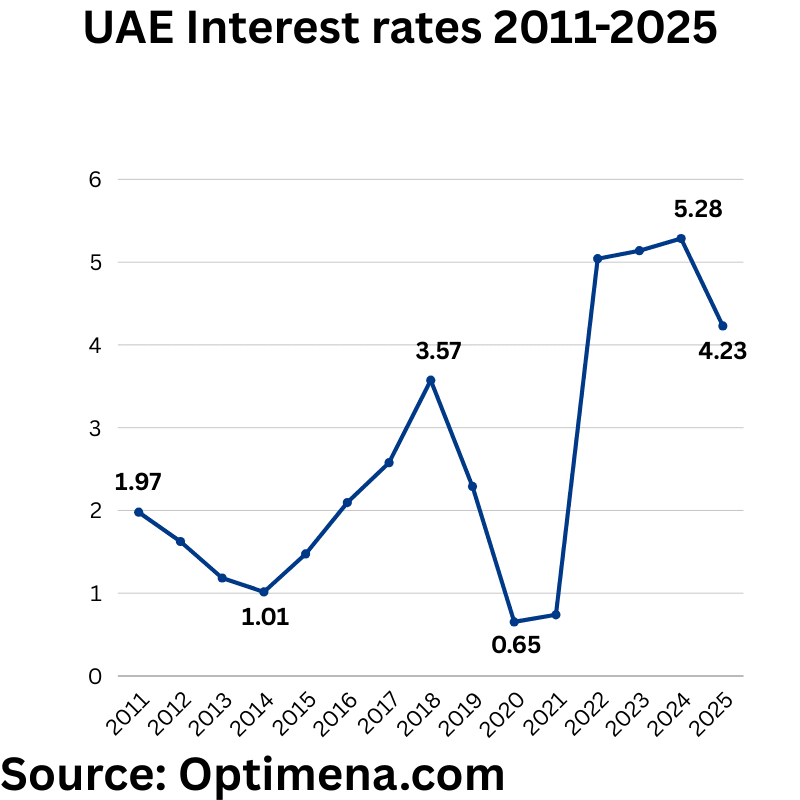
UAE Interest rates 2011-2025
2025 4.23%
2024 5.28558%
2023 5.13859%
2022 5.04211%
2021 0.73963%
2020 0.65382%
2019 2.28995%
2018 3.57365%
2017 2.57733%
2016 2.095%
2015 1.47457%
2014 1.01571%
2013 1.18429%
2012 1.625%
2011 1.97875%
The UAE’s interest rate trends from 2011 to 2025 reflect a **cyclical response** to both **global monetary policy shifts** and **domestic economic conditions**. From **2011 to 2015**, rates remained relatively low (around **1.47%–1.98%**) as the UAE maintained an accommodative monetary stance to support post-financial-crisis recovery.
Between **2016 and 2018**, interest rates climbed steadily, peaking at **3.57% in 2018**, tracking the **U.S. Federal Reserve’s tightening cycle**, as the UAE dirham is pegged to the U.S. dollar. This period corresponded with strong oil prices and robust economic activity.
From **2019 onwards**, rates began to decline, dropping sharply during the **COVID-19 pandemic** to **around 0.65% in 2020**, reflecting **aggressive monetary easing** to cushion the economy. Rates stayed low through **2021**.
Starting **2022**, the UAE entered a **sharp tightening phase**, with rates rising rapidly to above **5%**, mirroring the global fight against inflation. By **2025**, rates are expected to slightly ease to **4.23%**, indicating **moderating inflation** and a move toward **policy normalization** as the economy stabilizes.
Overall, the UAE’s interest rate movements showcase a **responsive and flexible monetary policy**, balancing growth, inflation control, and financial system stability.
UAE Trade Balance 2012-2021 (Billion $)
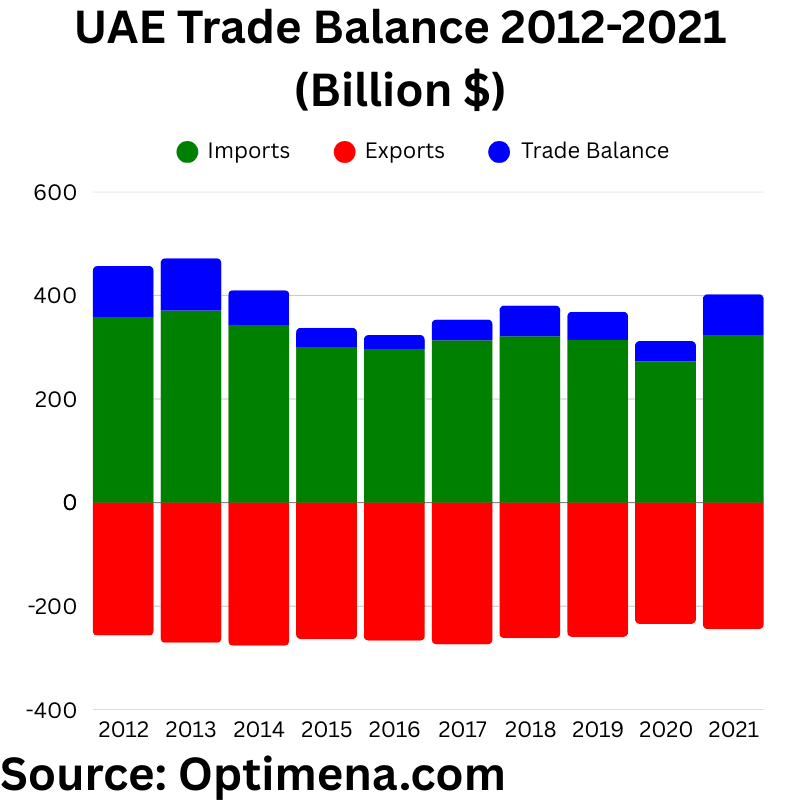
2012
– Total Exports : $356.65 Billion
-Total Imports : – $256.59 Billion
-Trade Balance : $100.06 Billion
2013
-Total Exports : $ 371.03 Billion
-Total Imports: -$270.62 Billion
-Trade Balance : $100.47 Billion
2014
-Total Exports : $ 343.03 Billion
– Total Imports: -$ 276.07 Billion
– Trade Balance : $67.02 Billion
2015
-Total Exports : $300.50 Billion
– Total Imports: -$263.47 Billion
-Trade Balance : $37.06 Billion
2016
-Total Exports : $295.07 Billion
-Total Imports : -$266.59 Billion
– Trade Balance : $28.45 Billion
2017
– Total Exports: $313.57 Billion
– Total Imports : -$273.75 Billion
-Trade Balance: $39.84 Billion
2018
– Total Exports : $321.03 Billion
-Total Imports : -$261.54 Billion
– Trade Balance : $59.52 Billion
2019
-Total Exports : $313.80 Billion
-Total Imports :- $259.26 Billion
– Trade Balance: $54.53 Billion
2020
– Total Exports: $273.11 Billion
– Total Imports: -$234.21 Billion
– Trade Balance : $38.90 Billion
2021
– Total Exports: $323.33 Billion
– Total Imports: -$244.37 Billion
– Trade Balance : $78.97 Billion
Between 2012 and 2021, the UAE maintained a consistently **positive trade balance**, highlighting its strength as a **leading export-driven economy**. In the early years (2012–2014), the UAE posted **robust trade surpluses**, exceeding **$100 billion** annually, largely supported by **high oil prices** and **strong non-oil exports**.
However, starting from **2015**, the trade surplus **narrowed significantly**, falling to **$37.06 billion** in 2015 and further declining to **$28.45 billion** by 2016. This contraction coincided with the **global collapse in oil prices**, which sharply reduced export revenues despite relatively stable import demand.
From **2017 onward**, trade performance showed gradual recovery, with exports strengthening and imports remaining contained. By **2021**, the trade surplus had rebounded to **$78.97 billion**, supported by **higher oil prices**, **diversification into non-oil sectors**, and the UAE’s strong positioning as a **re-export and logistics hub** amid global trade normalization post-COVID-19.
Overall, the UAE’s external sector demonstrates **resilience and adaptability**, leveraging both its **energy exports** and its role as a **global trade gateway**, even during periods of oil price volatility and global economic shocks.
UAE Foreign Exchange Reserves 2014-2025 (billion $)
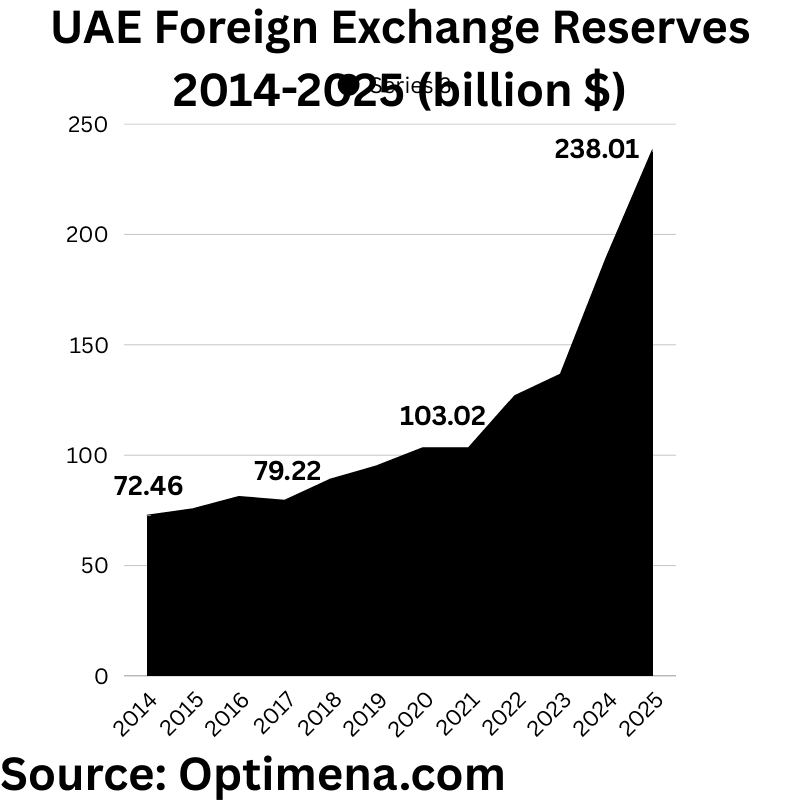
2014 $72.46 billion
2015 $75.34 billion
2016 $80.89 billion
2017 $79.22 billion
2018 $88.83 billion
2019 $ 94.82 billion
2020 $103.02 billion
2021 $103.02 billion
2022 $126.56 billion
2023 $136.38 billion
2024 $189.38 billion
2025 $238.01 billion
The UAE’s foreign exchange reserves have shown a **strong and steady growth trajectory** between 2014 and 2025, highlighting the country’s **financial resilience** and **macro-economic stability**. From **$72.46 billion in 2014**, reserves expanded consistently, reaching **$103 billion by 2020–2021**, even amid global uncertainties like the **COVID-19 pandemic**.
A major surge is observed from **2022 onwards**, with reserves climbing to **$126.56 billion** in 2022 and projected to hit **$238.01 billion by 2025**. This sharp increase reflects **higher oil revenues**, **stronger non-oil sector performance**, and **effective fiscal and monetary management**, including efforts to strengthen sovereign wealth buffers.
The continuous rise in reserves not only provides the UAE with a **strong cushion against external shocks** but also enhances **investor confidence**, supporting the country’s ambitions to position itself as a **global financial hub**.
UAE Foreign Direct Investment (FDI) inflows 2017-2023 (Billion $)
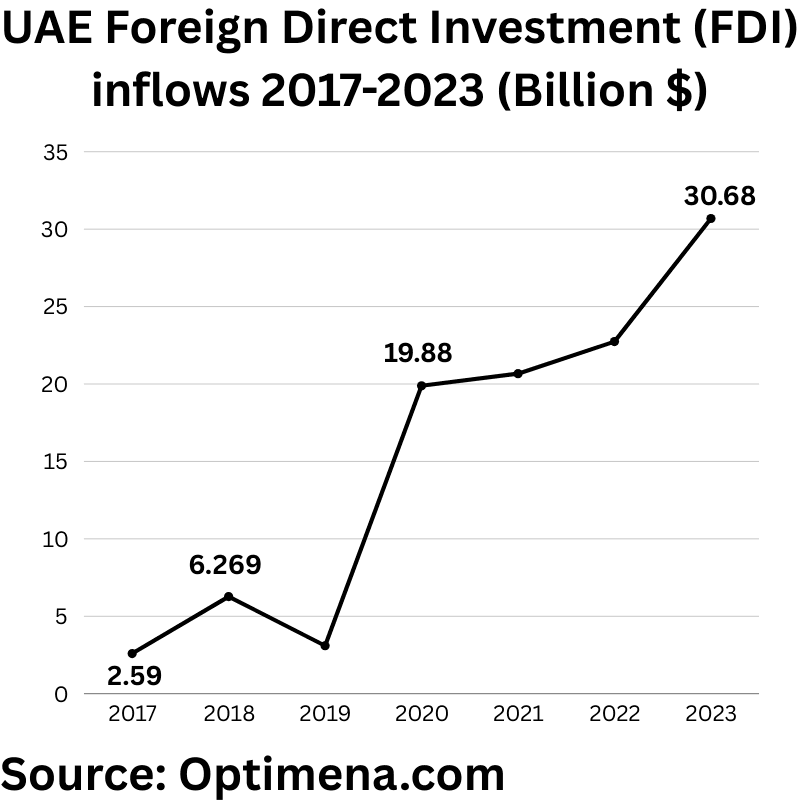
2017 $2.591 Billion
2018 $6.269 Billion
2019 $3.097 Billion
2020 $19.884 Billion
2021 $20.667 Billion
2022 $22.737 Billion
2023 $30.687 Billion
The UAE’s Foreign Direct Investment (FDI) inflows between 2017 and 2023 demonstrate a **remarkable upward trajectory**, underscoring the country’s success in becoming a **top global investment destination**. After modest inflows of **$2.59 billion in 2017** and **$3.10 billion in 2019**, FDI surged dramatically in **2020** to nearly **$19.88 billion**, despite global investment slowdowns caused by the **COVID-19 pandemic**.
This momentum continued, with FDI inflows reaching **$30.69 billion in 2023**, reflecting the UAE’s **aggressive economic reforms**, **liberalized ownership laws**, and focus on **diversifying beyond oil** into sectors like technology, renewable energy, finance, and logistics.
Index of Economic Freedom in UAE 2016-2024:
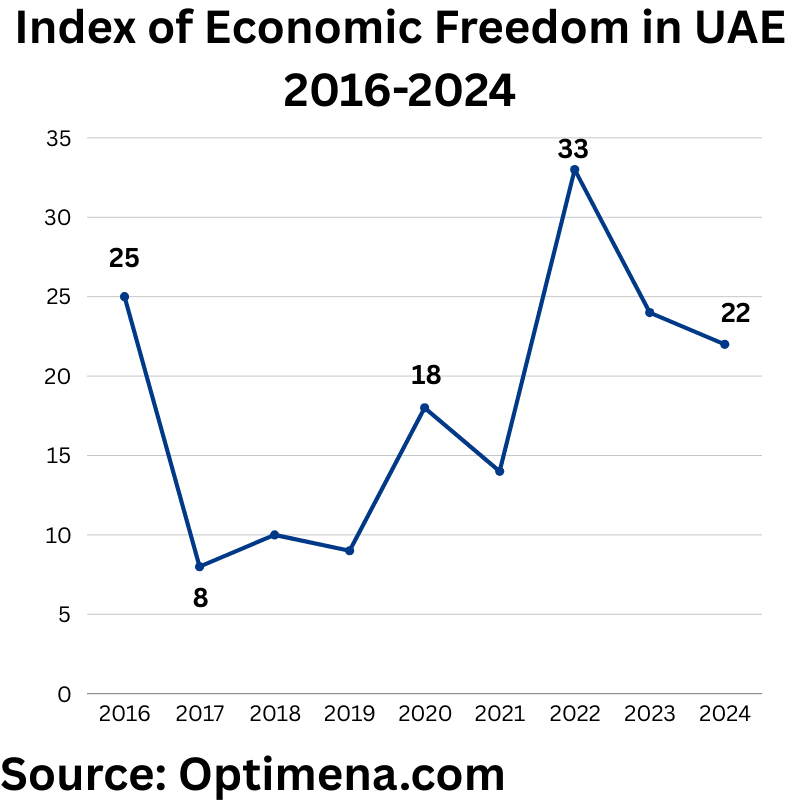
2016: 25
2017: 8
2018: 10
2019: 9
2020 : 18
2021: 14
2022: 33
2023: 24
2024: 22
The UAE’s Index of Economic Freedom rankings between 2016 and 2024 reflect **dynamic shifts** in its economic policy environment. After a relatively modest ranking of **25th in 2016**, the UAE made a **significant leap** to **8th place by 2017**, highlighting early successes in **regulatory reforms**, **investment liberalization**, and **market openness**.
Between **2018 and 2021**, the UAE maintained strong performance, consistently ranking within the **top 20** globally, signaling a **stable and pro-business climate**. However, rankings fluctuated afterward, slipping to **33rd in 2022**, likely influenced by **global pandemic impacts**, **policy adjustments**, or **measurement changes** in economic freedom factors.
By **2024**, the UAE had **recovered ground**, improving to **22nd place**, showing the country’s continued commitment to **enhancing competitiveness**, **streamlining regulations**, and **attracting foreign investment**, all crucial for achieving its long-term economic diversification goals.
UAE Demographic Outlook:
United Arab Emirates population 2011-2023 (Millions)
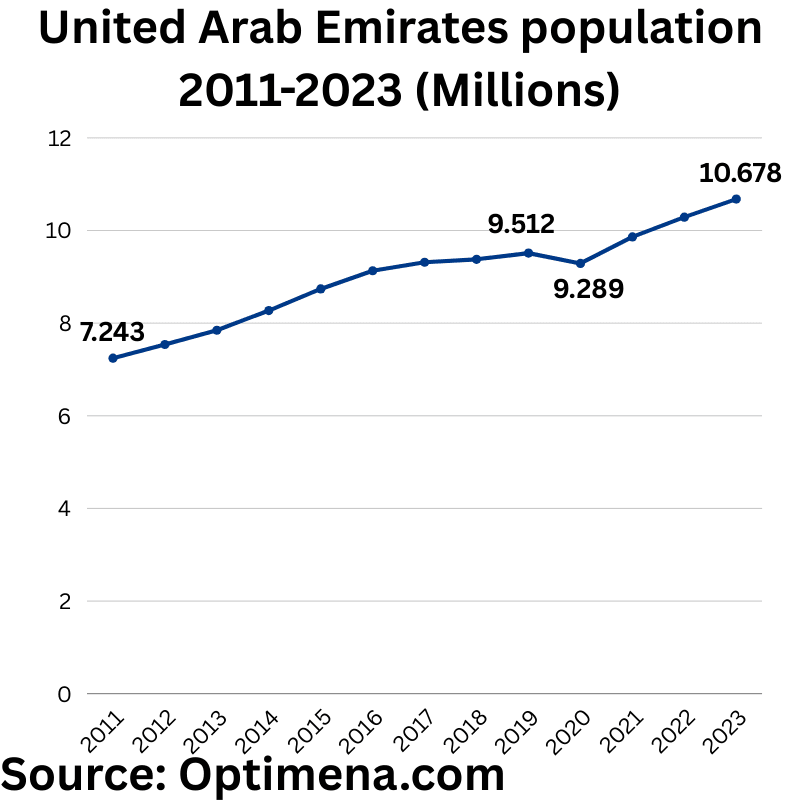
2011 7.243 millions
2012 7.539 millions
2013 7.846 millions
2014 8.272 millions
2015 8.738 millions
2016 9.131 millions
2017 9.314 millions
2018 9.378 millions
2019 9.512 millions
2020 9.289 millions
2021 9.861 millions
2022 10.288 millions
2023 10.678 millions
The UAE’s population grew steadily from **7.24 million in 2011** to **over 10.67 million by 2023**, reflecting the country’s **rapid economic expansion** and **attractiveness to expatriates**. Growth was particularly strong between **2011 and 2016**, driven by **infrastructure development**, **Expo 2020 preparations**, and a **booming service sector**.
Population growth stabilized slightly from **2017 to 2019**, as the economy matured. A minor dip in **2020** to **9.28 million** occurred due to the **COVID-19 pandemic** and associated **travel restrictions**. However, the UAE quickly rebounded, reaching a historic milestone of **over 10 million residents** by **2022**, boosted by **economic recovery**, **proactive immigration reforms**, and **long-term visa programs** targeting skilled professionals.
This steady population increase highlights the UAE’s **position as a global talent hub** and its **success in creating a resilient, diversified economy** that continues to attract residents from around the world.
UAE population pyramid ( age distribution)
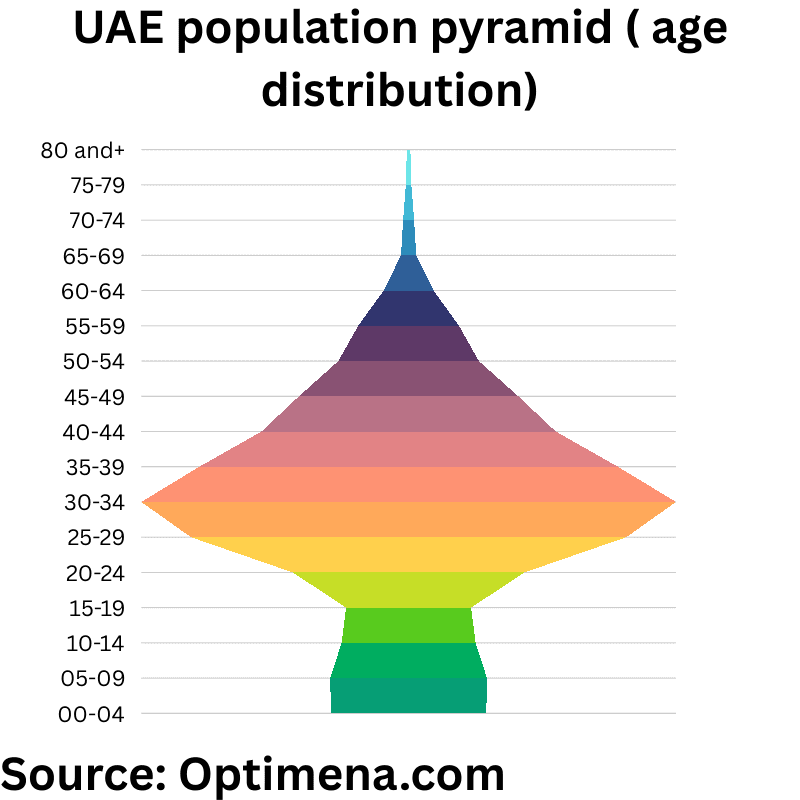
00-04 years 501000 (4.79%)
05-09 years 505000 (4.83%)
10-14 years 432000 (4.13%)
15-19 years 402000 3.85%
20-24 years 747000 7.15%
25-29 years 1403000 13.42%
30-34 years 1723000 16.48%
35-39 years 1348000 12.90%
40-44 years 948000 9.07%
45-49 years 707000 6.76%
50-54 years 453000 4.33%
55-59 years 325000 3.11%
60-64 years 161000 1.54%
65-69 years 49000 0.47%
70-74 years 35000 0.34%
75-79 years 17400 0.17%
80 and + years 11700 0.11%
The UAE’s population pyramid is **heavily concentrated in the 25–39 age range**, which together accounts for **over 42% of the total population**. This reflects the UAE’s **young and highly active workforce**, primarily driven by **economic migration** to support sectors like **construction**, **hospitality**, **technology**, and **finance**.
The relatively **small share of children and elderly** — with those under 15 years forming around **13.75%** of the population and those 65+ making up **less than 1%** — indicates a **low dependency ratio**. This demographic structure is typical of **economies reliant on expatriate labor** and **temporary workers**, rather than long-term population growth through natural increase.
Such a youthful and working-age-dominant population offers the UAE significant **economic advantages**, such as a **productive labor force** and **lower healthcare and pension burdens** — but it also emphasizes the need for **sustainable migration policies** and **long-term integration strategies**.
If you require customized market research, in-depth industry reports about the UAE or other GCC countries, our team at Optimena is here to support you.
For tailored studies, detailed data, or further information, feel free to contact us— we’ll be happy to assist your business or investment decisions.


