Overview:
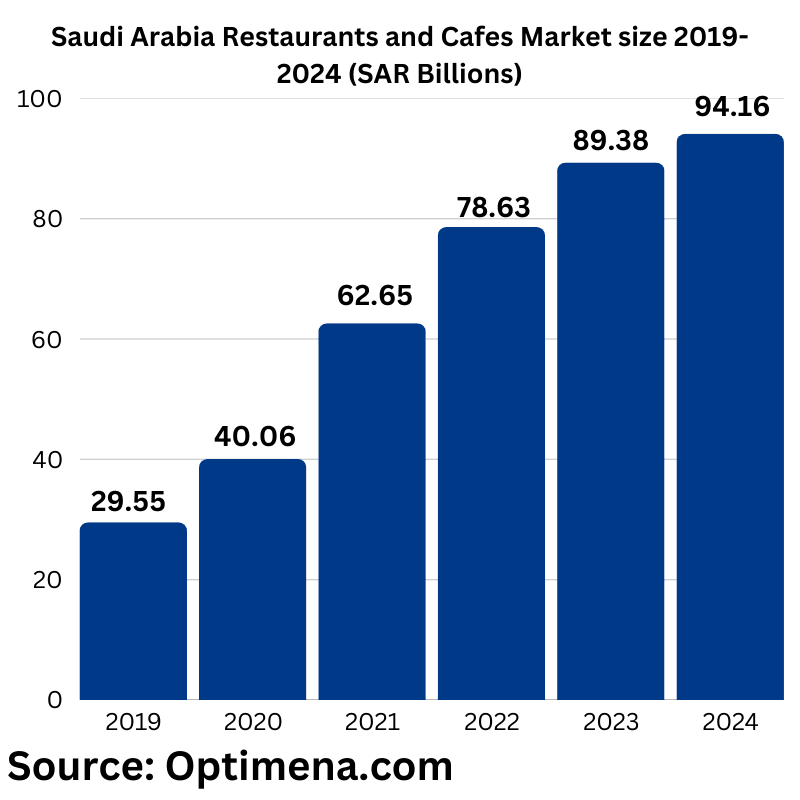
The restaurant and café market in Saudi Arabia experienced rapid growth between 2019 and 2021, followed by significant growth from 2021 to 2024, as illustrated below:
The market size in 2019 was estimated at SAR 29.55 billion (approximately USD 7.87 billion), with 473.7 million transactions.
In 2020, the market size reached SAR 40.06 billion (approximately USD 10.67 billion), with 769.02 million transactions.
By 2021, the market size surged to SAR 62.65 billion (approximately USD 16.68 billion), with 1.44806 billion transactions.
The market size in 2022 was estimated at SAR 78.63 billion (approximately USD 20.64 billion), with 2.04837 billion transactions.
In 2023, the market size grew to SAR 89.38 billion (approximately USD 23.8 billion), with 2.5598 billion transactions.
For 2024, projections estimate the market size at SAR 94.16 billion (approximately USD 25.07 billion), with 2.74416 billion transactions.
Growth Rates in Saudi Restaurants and Cafes Market Sales Volume and Transactions:
The growth trends in the Saudi restaurant and café market reflect a dynamic and thriving industry:
2020: Sales volume grew by 35.56%, and transactions increased by 62.34% compared to 2019.
2021: Sales volume grew by 56.39%, and transactions increased by 88.29% compared to 2020.
2022: Sales volume grew by 25.5%, and transactions increased by 41.45% compared to 2021.
2023: Sales volume grew by 13.67%, and transactions increased by 24.97% compared to 2022.
2024: Projections indicate a growth in sales volume by 16.36%, and transactions by 30.24% compared to 2023.
Key Insight: The consistent growth in transactions showcases the rising demand for dining and café experiences in the Saudi market, driven by lifestyle changes and population growth.
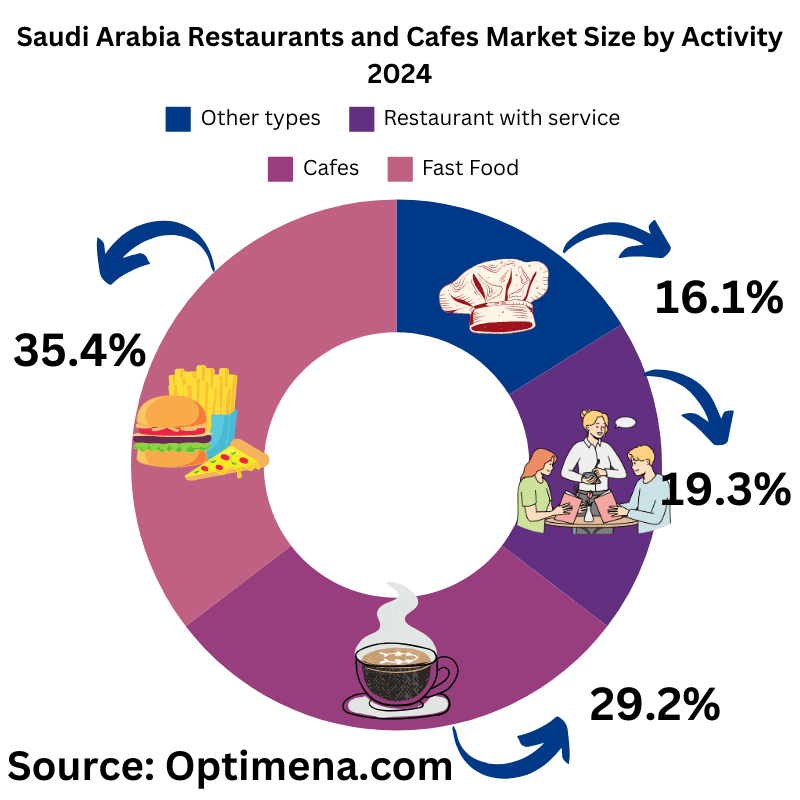
Saudi Restaurants and Cafes Market Share by Activity (2024):
The Saudi restaurant and café market is categorized into four main segments:
Quick Service Restaurants (QSR) or Fast Food Restaurants:
Market share: 35.4%
Sales volume: SAR 33.33 billion (USD 8.88 billion)
- Cafés:
Market share: 29.2%
Sales volume: SAR 27.5 billion (USD 7.32 billion).
Full-Service Restaurants:
Market share: 19.3%
Sales volume: SAR 18.17 billion (USD 4.84 billion).
Other Activities:
Market share: 16.1%
Sales volume: SAR 15.16 billion (USD 4.04 billion).
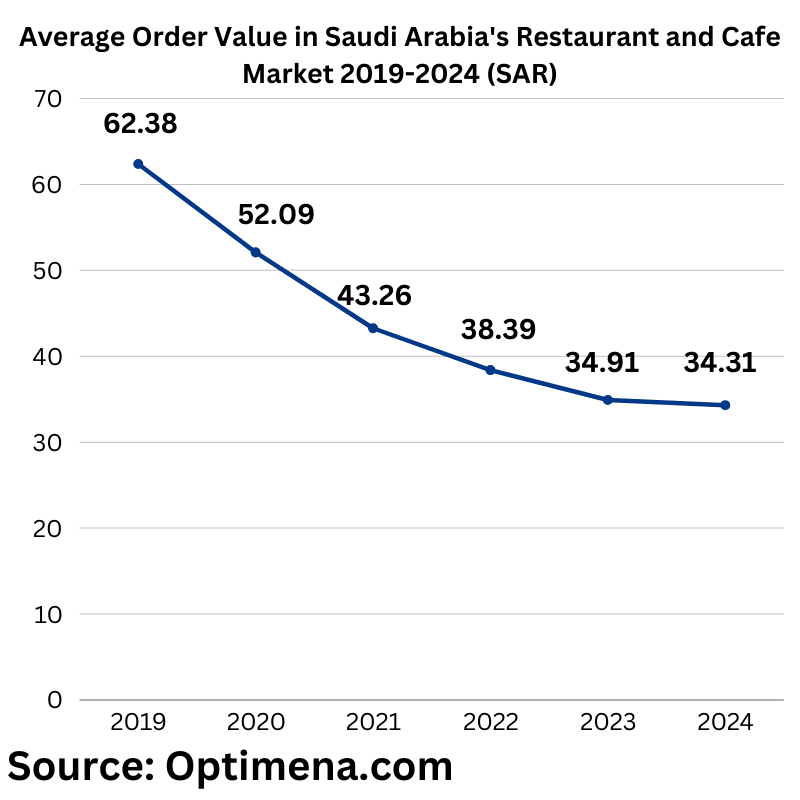
Average Order Value (AOV) in Saudi Arabia Restaurants and Cafes Market (2019-2024):
From 2019 to 2024, the AOV in the restaurant and café market exhibited a steady decline:
2019: AOV was SAR 62.38 (USD 16.16).
2024: AOV is projected to decline to SAR 34.31 (USD 9.14).
The AOV was calculated by dividing the total sales volume by the number of transactions in each year.
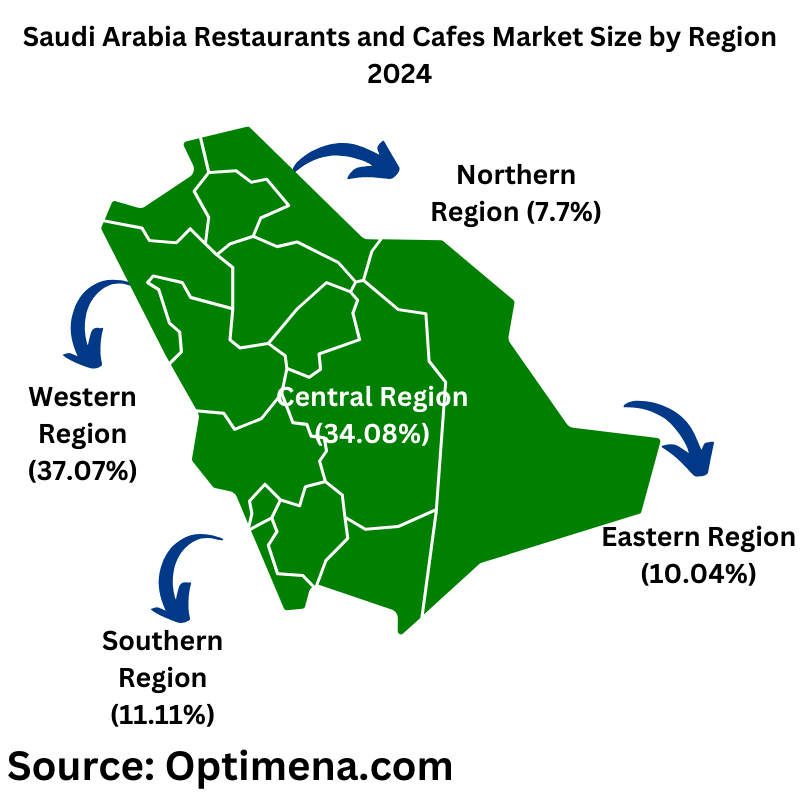
Saudi Restaurants and Cafes Market Size by Region (2024):
The regional distribution of the Saudi restaurant and café market highlights key areas of growth:
Western Region: Largest market share at 37.07%, equivalent to SAR 34.90 billion (USD 9.29 billion).
Central Region: Holds 34.08%, equivalent to SAR 32.09 billion (USD 8.54 billion).
Southern Region: Accounts for 11.11%, with sales of SAR 10.46 billion (USD 2.79 billion).
Eastern Region: Represents 10.04%, with sales of SAR 9.45 billion (USD 2.52 billion).
Northern Region: Smallest share at 7.7%, with sales of SAR 7.25 billion (USD 1.93 billion).
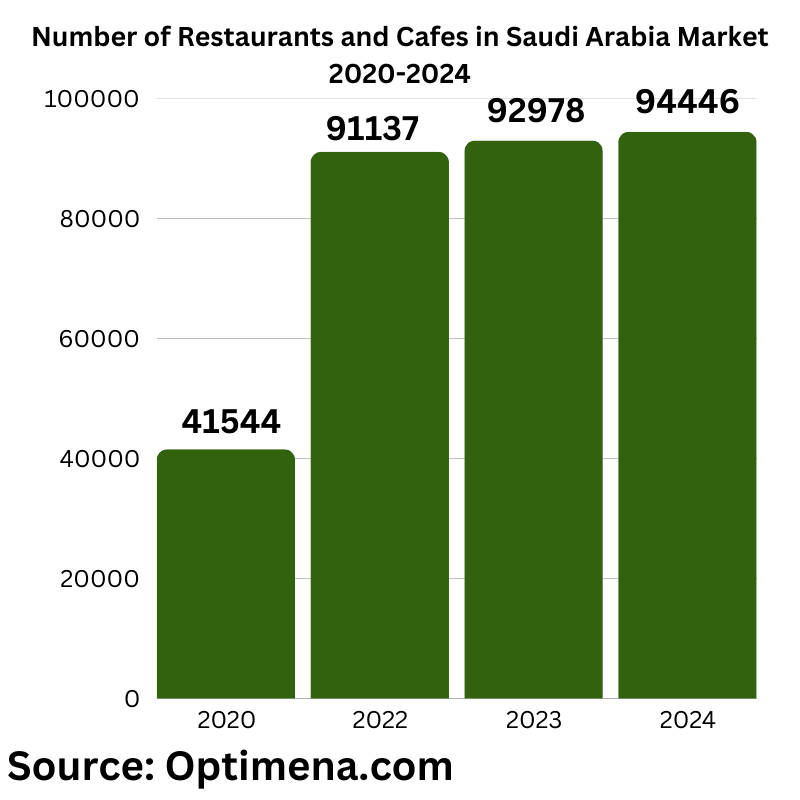
Number of Restaurants and Cafés in Saudi Arabia (2020-2024):
2020: 41,544 establishments.
2022: 91,137 establishments, a 219% increase over two years.
2023: 92,978 establishments, a 2.02% increase over 2022.
Mid-2024: 94,446 establishments, a 1.58% increase over 2023.
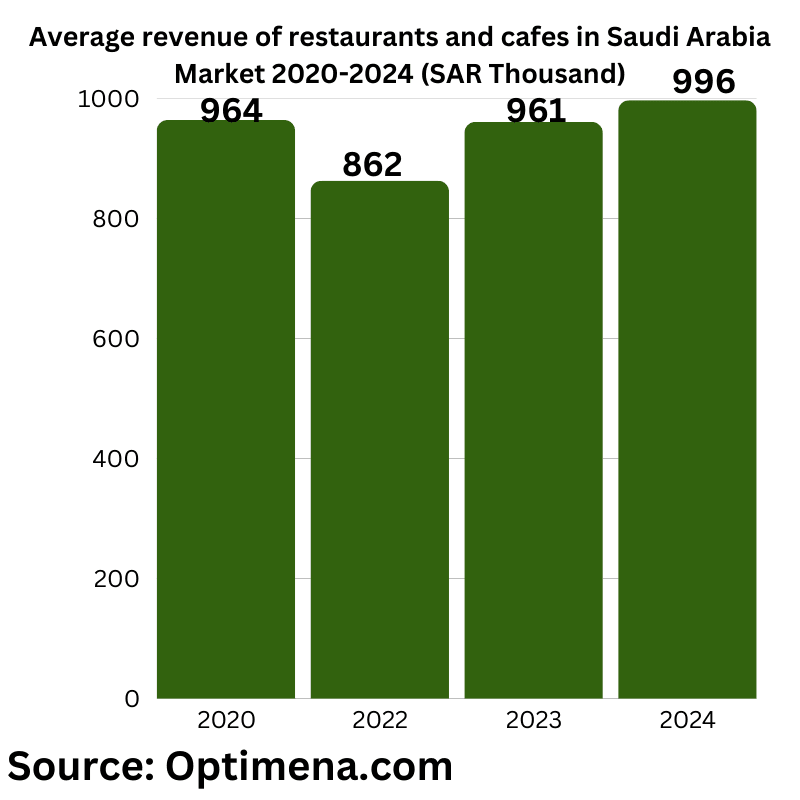
Average Revenues for Restaurants and Cafés in Saudi Arabia (2020–2024):
The average revenue for restaurants and cafés in Saudi Arabia was calculated based on the total transactions during the year divided by the number of establishments in the same year. The results are as follows:
2020: The average revenue was SAR 964,278 per establishment.
2022: The average revenue was SAR 862,767 per establishment.
2023: The average revenue was SAR 961,302 per establishment.
2024: The average revenue is projected at SAR 996,971 per establishment.
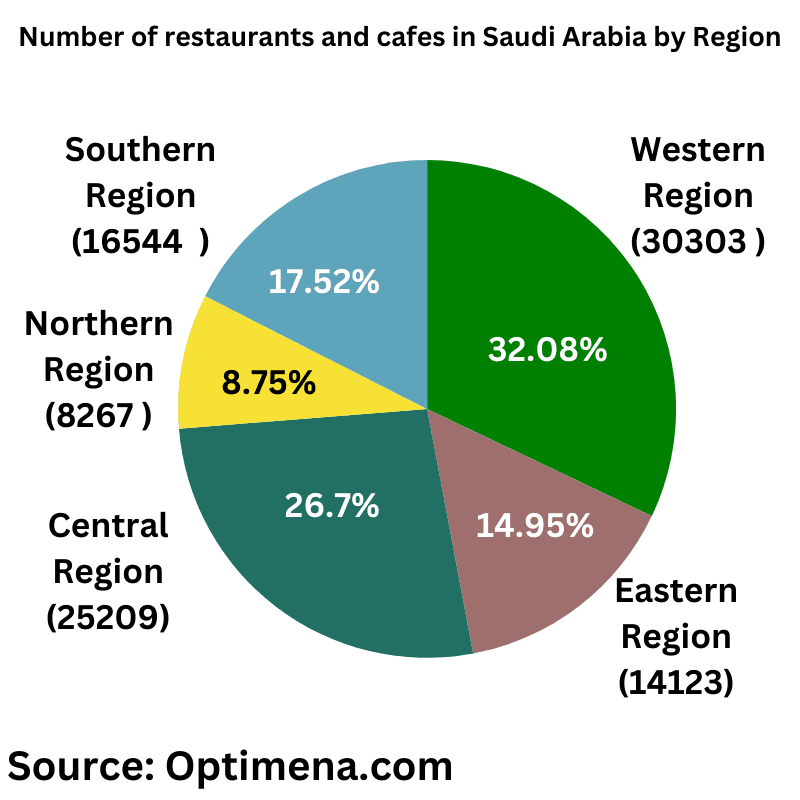
Number of Restaurants and Cafés in Saudi Arabia by Geographic Regions (2024):
Out of the total 94,446 restaurants and cafés spread across Saudi Arabia in 2024:
Western Region:
Share: 32.08%
Number of establishments: 30,303.
Central Region:
Share: 26.7%
Number of establishments: 25,209.
Southern Region:
Share: 17.52%
Number of establishments: 16,544.
Eastern Region:
Share: 14.95%
Number of establishments: 14,123.
Northern Region:
Share: 8.75%
Number of establishments: 8,267.
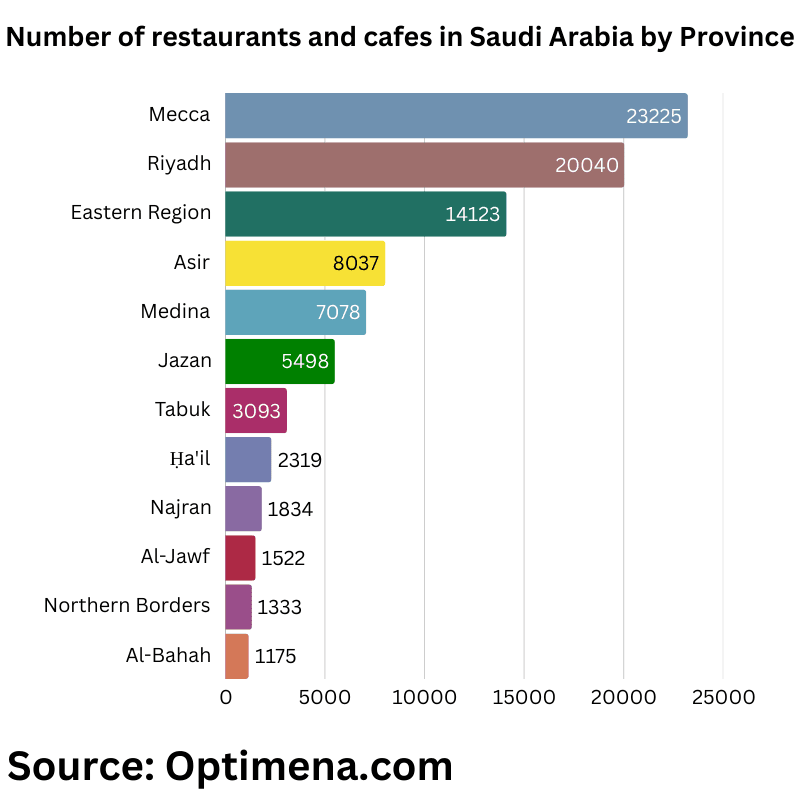
Number of Restaurants and Cafés by Provinces (2024):
Makkah Province:
Leading with 23,225 establishments, representing 24.59% of the total.
Riyadh Province:
Second with 20,040 establishments, representing 21.22% of the total.
Eastern Province:
Third with 14,123 establishments, representing 14.95% of the total.
Northern Borders Province:
Penultimate with 1,333 establishments, representing 1.41%.
Al-Baha Province:
Last with 1,175 establishments, representing 1.24%.
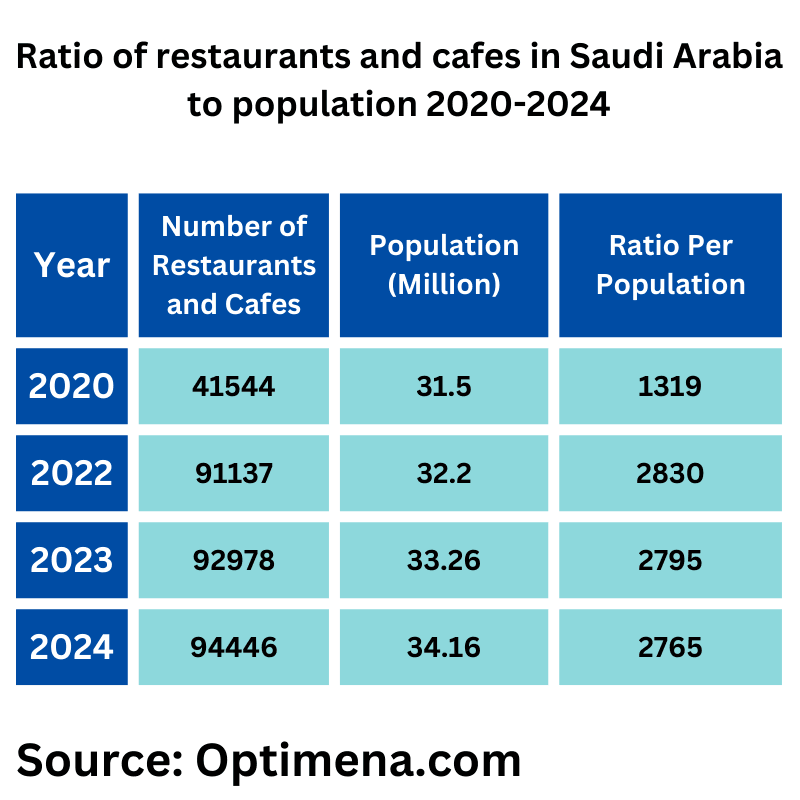
Restaurants and Cafés per Capita in Saudi Arabia:
2022:
Population: 32.2 million.
Number of establishments: 91,137.
Average:
2,830 establishments per million people.
Breakdown: 2,004 restaurants and 826 cafés per million people.
2024:
Population: 34.16 million (as per Worldometers).
Number of establishments: 94,446.
Average:
2,765 establishments per million people.
Employment in the Restaurant Sector:
As of 2023, the number of workers in Saudi Arabia’s restaurant and café sector was approximately 605,882.
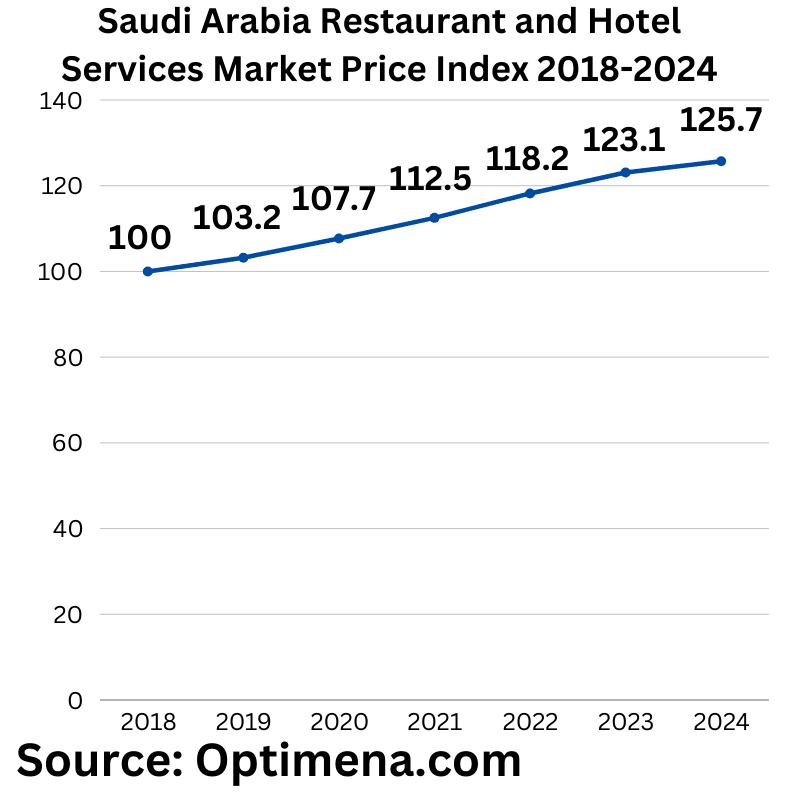
Price Index for Restaurant and Hotel Services in Saudi Arabia:
This index tracks changes in accommodation and food service prices compared to the base year (2018), where the index was set at 100.
Any value above 100 reflects an increase in prices since 2018.
Price hikes are attributed to rising operational costs, raw material prices, and transportation expenses.