Overview:
If you’re looking to invest or expand in Qatar, understanding its economic shifts is essential — and Optimena’s market research services can provide the insights you need, So Contact us and let’s discuss your needs.
Qatar’s economy remains fundamentally tied to hydrocarbons, but it’s evolving. From a GDP peak of \$235 billion in 2022 to a slight dip and stabilization around \$195 billion in 2024, fluctuations reflect global energy trends, infrastructure investment cycles, and post-World Cup normalization. The economic structure remains dominated by the mining sector (37.1%), yet other sectors like finance, construction, and real estate are showing signs of meaningful diversification.
Inflation has swung from deflation (2019–2021) to post-pandemic inflation, now settling at a moderate 2.9% in 2024. Trade surpluses, though no longer at 2012 levels, remain strong, while rising imports hint at growing internal demand and investment. Meanwhile, Qatar’s foreign exchange reserves are steadily climbing, expected to reach \$70B by 2025, reflecting fiscal prudence. The population has grown by 38% from 2014 to 2023, largely fueled by labor demands tied to infrastructure and energy sectors.
Qatar Economic Outlook:
Qatar Gross domestic product (GDP) 2011-2024 (Billion $)
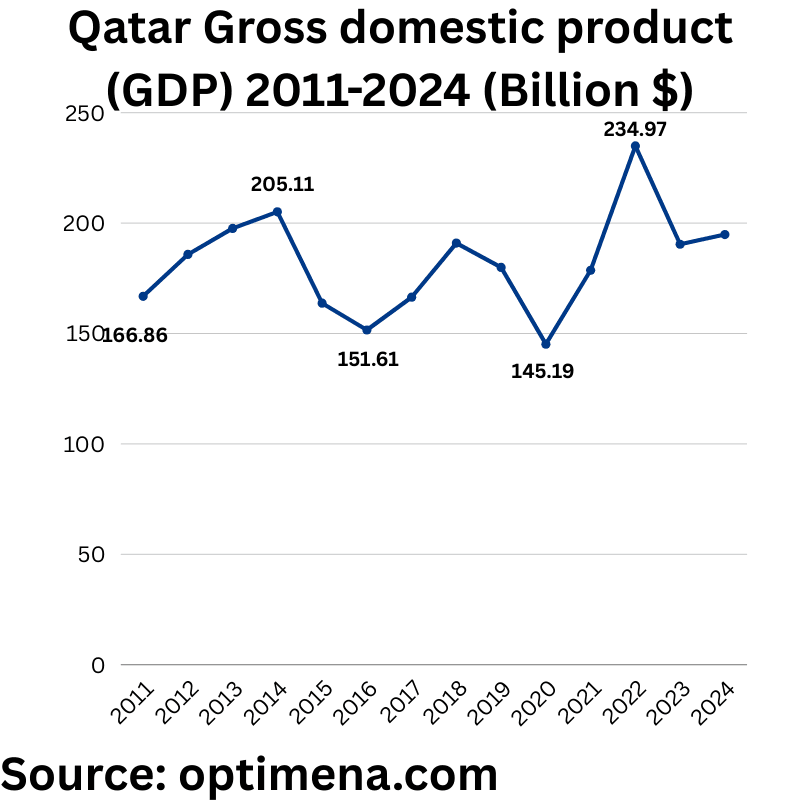
2011 $166.86 Billion
2012 $185.82 Billion
2013 $197.62 Billion
2014 $205.11 Billion
2015 $163.74 Billion
2016 $151.61 Billion
2017 $166.45 Billion
2018 $190.96 Billion
2019 $179.95 Billion
2020 $145.19 Billion
2021 $178.66 Billion
2022 $234.97 Billion
2023 $190.44 Billion
2024 $194.81 Billion
Qatar’s GDP reflects volatility tied to hydrocarbon dependence and strategic investments. From 2011–2014, growth peaked at $205B (2014), driven by high oil prices and LNG expansion. The 2015–2016 oil crash triggered a sharp drop (to $152B), exposing economic vulnerability. Recovery began in 2017, fueled by infrastructure spending (World Cup 2022 prep), pushing GDP to a record $235B in 2022. Post-event normalization and lower energy prices caused a 2023 dip ($190B), with modest 2024 growth ($195B) signaling stabilization. Non-oil sectors (tourism, logistics) now buffer volatility, but hydrocarbon revenues (LNG) remain pivotal. Fiscal buffers (sovereign wealth) mitigate risks, yet diversification lags regional peers like UAE/Saudi.
Contribution of economic activities to qatar GDP:
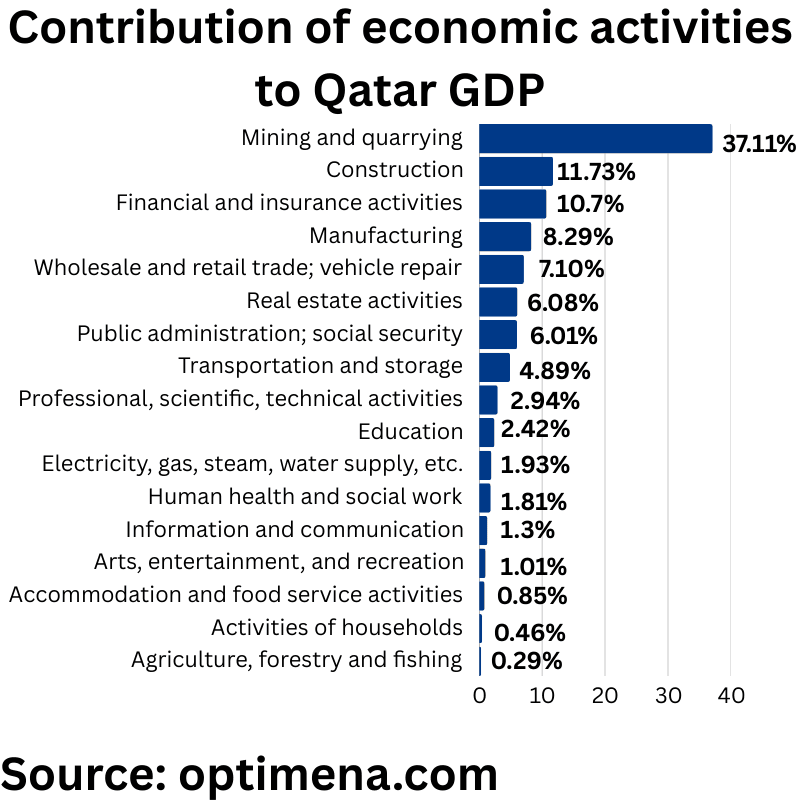
Agriculture, forestry and fishing $160.38 million (0.29%)
Mining and quarrying $20.69 Billion (37.11%)
Manufacturing $4.62 Billion (8.29%)
Electricity, gas, steam, water supply, etc. $1.08 Billion (1.93%)
Construction $6.53 Billion (11.73%)
Wholesale and retail trade; vehicle repair $3.96 Billion (7.10%)
Transportation and storage $2.73 Billion (4.89%)
Accommodation and food service activities $473 Million (0.85%)
Information and communication $727.05 Million (1.30%)
Financial and insurance activities $5.96 Billion (10.70%)
Real estate activities $3.39 Billion (6.08%)
Professional, scientific, technical activities $1.64 Billion (2.94%)
Public administration; social security $3.35 Billion (6.01%)
Education $1.35 Billion (2.42%)
Human health and social work $1.01 Billion (1.81%)
Arts, entertainment, and recreation $563.66 Million (1.01%)
Activities of households $257.92 Million (0.46%)
Qatar’s GDP demonstrates a classic hydrocarbon-dependent Gulf economy with some notable diversification efforts.
The economy is heavily dominated by the mining and quarrying sector (primarily oil and gas) at 37.11% of GDP ($20.69 billion). This represents Qatar’s traditional economic engine but shows a lower hydrocarbon dependency than in previous decades when this sector often exceeded 50% of GDP.
Supporting sectors show meaningful economic diversification:
– Construction (11.73%) and finance/insurance (10.70%) are robust secondary pillars
– Manufacturing (8.29%) reflects downstream value addition from hydrocarbon products
– Wholesale/retail trade (7.10%) and real estate (6.08%) represent domestic economy strength
The tertiary sector is developing but still modest:
– Knowledge economy sectors (professional/scientific activities, information/communication, education) collectively represent only about 6.66% of GDP
– Tourism indicators (accommodation/food service) remain minimal at 0.85%
Agriculture’s negligible contribution (0.29%) reflects Qatar’s harsh desert environment and water scarcity.
This sectoral distribution reveals Qatar’s ongoing economic transformation – maintaining hydrocarbon strength while gradually building diversification pillars in finance, construction, and real estate. The path toward Vision 2030’s knowledge economy ambitions will require further development of the country’s professional, educational, and technology sectors.
Qatar Inflation rates 2011-2024:

2011 1.8%
2012 1.5%
2013 2.7%
2014 3.5%
2015 2.1%
2016 3.1%
2017 1%
2018 0.7%
2019 -1.3%
2020 -0.8
2021 -0.3%
2022 4.4%
2023 4.1%
2024 2.9%
2011-2016: Moderate Stability Phase
Inflation remained relatively controlled between 1.5-3.5%, characteristic of a hydrocarbon-wealthy economy with strong fiscal buffers. This period coincided with Qatar’s pre-World Cup infrastructure development while maintaining price stability.
2017-2021: Deflationary Period
A remarkable shift occurred from moderate inflation to persistent deflation, with rates dropping to 1% in 2017 and turning negative for three consecutive years (2019-2021). This unusual deflationary stretch likely resulted from:
– The 2017 Gulf diplomatic crisis and subsequent economic blockade
– Real estate market corrections following oversupply
– Domestic market stabilization measures
– COVID-19 pandemic demand suppression (2020-2021)
2022-2024: Inflationary Rebound
Sharp reversal to significant inflation (4.4% in 2022, 4.1% in 2023) driven by:
– Post-pandemic global supply chain disruptions
– Energy price volatility following the Russia-Ukraine conflict
– FIFA World Cup demand surge
– Normalization of regional relations
The moderating trend to 2.9% in 2024 suggests Qatar’s return to equilibrium as global pressures ease and domestic monetary policy adjustments take effect.
This inflation pattern demonstrates Qatar’s economic resilience despite significant external shocks, with current rates returning to a more sustainable level consistent with moderate growth in a resource-rich Gulf economy.
Qatar Trade Balance 2012-2024 (Billion $):
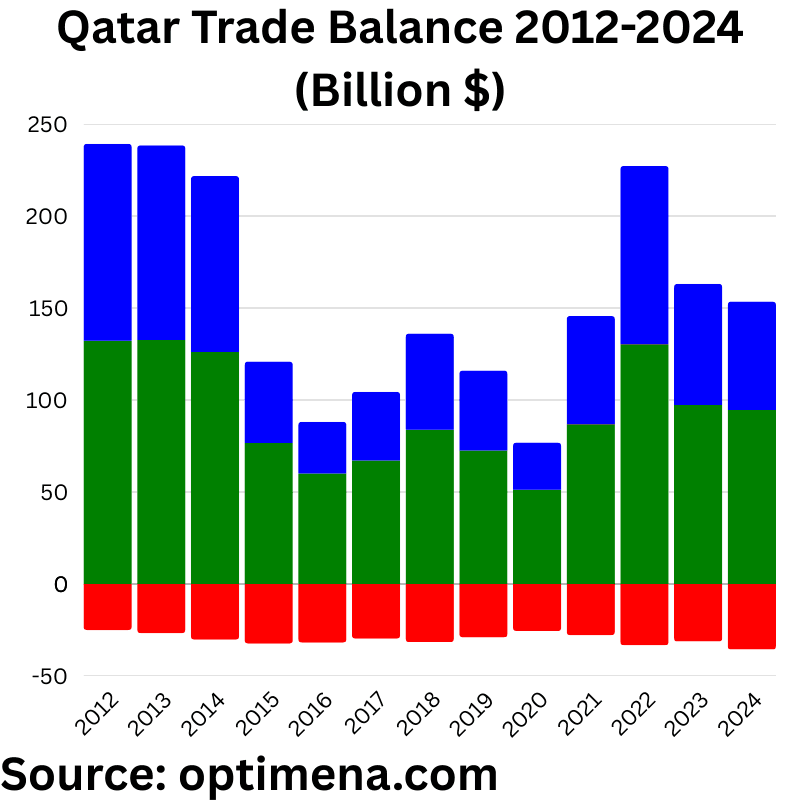
2012
Imports: $ 25.08 Billion
Exports: $132.19 Billion
Trade Balance: $107.11 Billion
2013
Imports: $26.72 Billion
Exports:$132.6 Billion
Trade Balance: $105.88 Billion
2014
Imports: $30.28 Billion
Exports:$126.02 Billion
Trade Balance:$95.74 Billion
2015
Imports: $32.43 Billion
Exports:$76.67 Billion
Trade Balance: $44.24 Billion
2016
Imports: $31.88 Billion
Exports:$60 Billion
Trade Balance: $28.12 Billion
2017
Imports: $29.73 Billion
Exports:$67.13 Billion
Trade Balance:$37.4 Billion
2018
Imports: $31.52 Billion
Exports: $83.85 Billion
Trade Balance: $52.33 Billion
2019
Imports: $29.02 Billion
Exports: $72.55 Billion
Trade Balance: $43.53 Billion
2020
Imports: $25.56 Billion
Exports: $51.23 Billion
Trade Balance: $25.67 Billion
2021
Imports: $27.83 Billion
Exports: $86.76 Billion
Trade Balance: $58.93 Billion
2022
Imports: $33.30 Billion
Exports: $130.27 Billion
Trade Balance: $96.97 Billion
2023
Imports: $31.27 Billion
Exports:$97.22 Billion
Trade Balance: $65.95 Billion
2024
Imports: $35.60 Billion
Exports: $94.55 Billion
Trade Balance: $58.95 Billion
Qatar’s trade balance from 2012-2024 reveals a classic petro-economy narrative with distinctive phases reflecting global energy market fluctuations and strategic economic responses:
2012-2014: Peak Surplus Era
Exceptional trade surpluses (>$95B annually) driven by premium hydrocarbon pricing and Qatar’s expanded LNG capacity. This period represented Qatar’s golden era of trade surpluses with exports exceeding $125B annually while maintaining modest import levels around $25-30B.
2015-2017: Sharp Contraction
Dramatic collapse in trade surplus (74% decline from 2012-2016) primarily due to:
– Global oil price crash (2014-2016)
– Regional diplomatic blockade effects (2017)
– Relatively stable import spending despite export decline
2018-2021: Volatile Recovery Period
Fluctuating trade performance characterized by:
– Modest recovery (2018-2019) with improved energy markets
– Severe COVID-related contraction (2020) with surplus hitting decade-low $25.67B
– Strong rebound in 2021 as global economic reopening boosted energy demand
2022-2024: Resurgence and Moderation
Remarkable recovery to near-peak levels in 2022 ($96.97B surplus) driven by energy price spikes following the Russia-Ukraine conflict, followed by moderation in 2023-2024 as energy markets stabilized.
Notable is Qatar’s consistent trade surplus despite significant external shocks, underscoring the nation’s robust export capacity. However, the increasing import trend ($35.6B in 2024, highest in the series) may reflect both economic diversification investments and potential vulnerability to future export volatility.
This pattern demonstrates Qatar’s continued trade strength while highlighting the persistent challenge of hydrocarbon dependency in its export portfolio.
Qatar Foreign Exchange Reserves 2019-2025 (billion $):
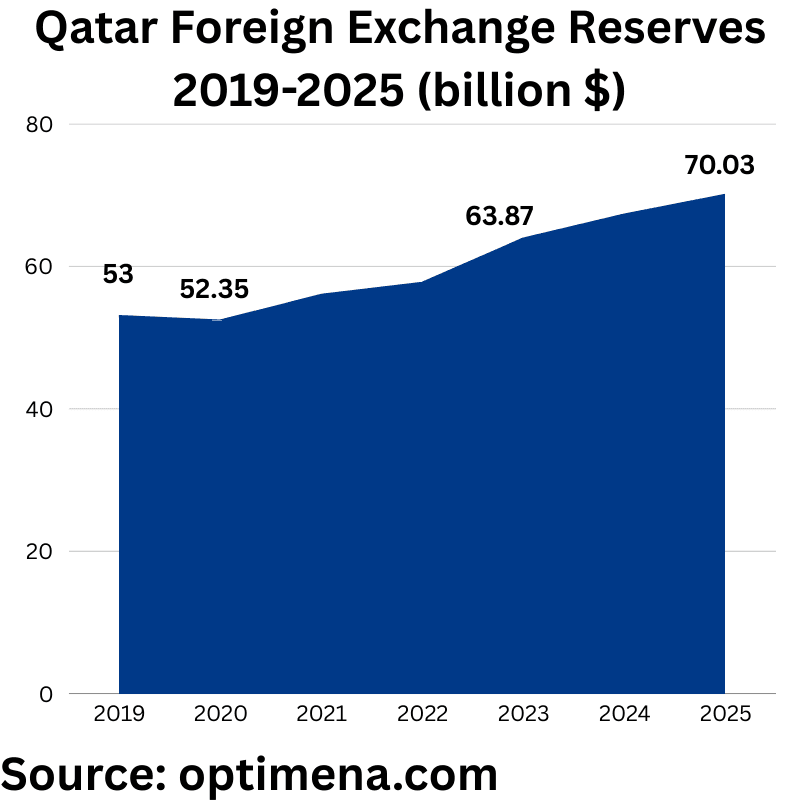
2019 $53 billion
2020: $52.35 billion
2021: $55.97 billion
2022: $57.67 billion
2023: $63.87 billion
2024: $67.23 billion
2025: $70.03 billion
Qatar’s foreign exchange reserves from 2019-2025 demonstrate a consistent strengthening trajectory that reflects prudent macroeconomic management and strategic financial positioning:
2019-2020: Stability During Crisis
The modest contraction in reserves (-1.2%) during 2020 represents remarkable resilience in the face of dual shocks:
– Global COVID-19 pandemic disruptions
– Energy market volatility with significant price suppression
This minimal drawdown highlights Qatar’s fiscal discipline and effective economic stabilization mechanisms during extreme market conditions.
2021-2023: Strategic Accumulation Phase
The steady year-on-year growth (average 7.2% annually) reflects:
– Post-pandemic economic recovery
– Windfall gains from energy price spikes (particularly 2022)
– Prudent surplus management prioritizing reserve reinforcement
– Pre-World Cup economic confidence-building measures
2023-2025: Continued Strengthening
The consistent reserve expansion to record levels ($70.03B in 2025) indicates:
– Commitment to building robust fiscal buffers against future hydrocarbon volatility
– Preparation for potential regional geopolitical uncertainties
– Support for currency stability and investment-grade sovereign credit ratings
This reserves trajectory demonstrates Qatar’s financial maturity and counter-cyclical fiscal approach, positioning the nation with approximately 18-20 months of import coverage – well above IMF recommendations for resource-dependent economies. The consistent upward trend even during periods of trade balance moderation suggests disciplined revenue management and strategic prioritization of financial security over immediate domestic expenditure.
Qatar Demographic Outlook:
Qatar population 2014-2023 (Millions):
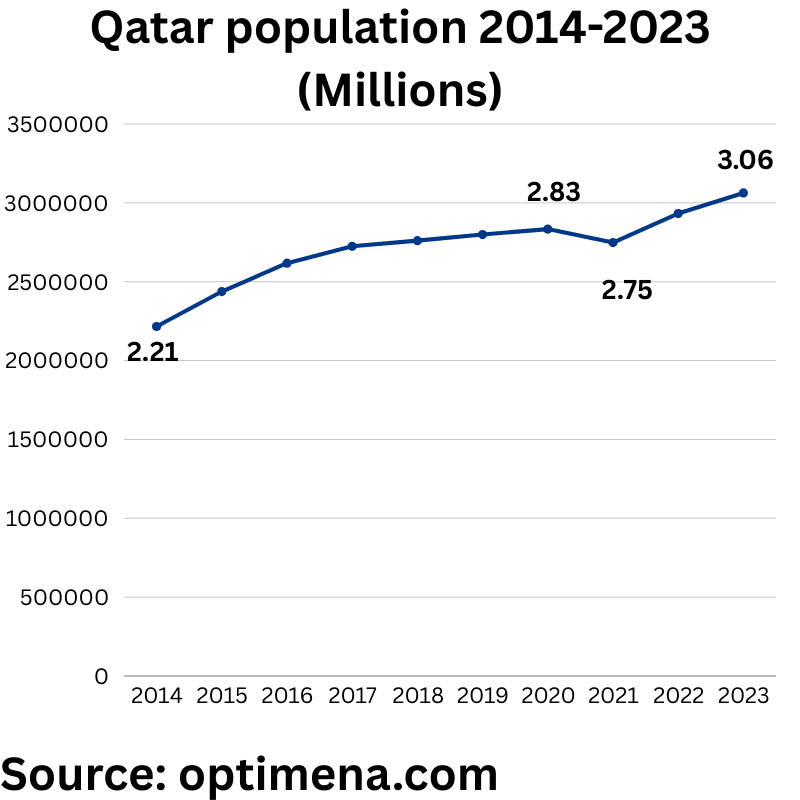
Year Total Population
2014 2,216,180
2015 2,437,790
2016 2,617,634
2017 2,724,606
2018 2,760,170
2019 2,799,202
2020 2,833,679
2021 2,748,162
2022 2,932,241
2023 3,063,005
Qatar’s population trends from 2014-2023 reveal a strategic demographic trajectory closely aligned with the nation’s economic development cycles and major infrastructure initiatives:
2014-2017: Rapid Expansion Phase
This period saw exceptional population growth (23% over three years) driven primarily by:
– Massive labor importation for World Cup infrastructure projects
– Expansion of hydrocarbon facilities and industrial capacity
– Growth in supporting service sectors requiring expatriate labor
This represented Qatar’s most accelerated demographic expansion phase in its modern history.
2018-2020: Stabilization Period
Population growth moderated significantly (4% over three years) reflecting:
– Completion of major early-stage construction projects
– Implementation of labor market rationalization policies
– Early impacts of regional diplomatic tensions affecting regional expatriate flows
2021: Pandemic-Induced Contraction
The notable 3% population decline marks the only reduction in the decade, attributable to:
– COVID-19 related workforce repatriation
– Temporary project pauses
– Strategic workforce optimization during global uncertainty
2022-2023: World Cup Culmination and Recovery
The sharp population rebound (11.5% growth over two years) coincides with:
– Final World Cup preparation surge requiring additional labor
– Post-pandemic economic recovery
– Expansion of service sectors supporting tournament operations
– Post-tournament stabilization of resident numbers
Qatar’s demographic profile remains overwhelmingly expatriate-driven (approximately 88% foreign), creating a highly elastic population responsive to economic planning decisions and project cycles. The consistent upward trajectory despite temporary fluctuations reflects Qatar’s continued economic expansion requiring substantial imported labor across skill categories.
Qatar population pyramid ( age distribution):
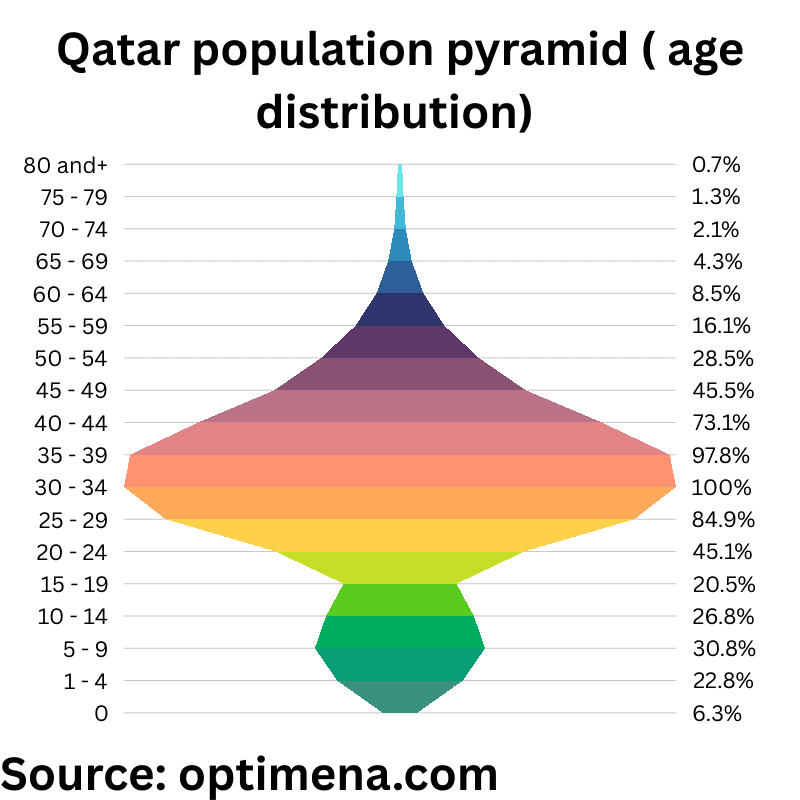
0 31,205 (1.20%)
1 – 4 113,392 (4.36%)
5 – 9 153,726 (5.91%)
10 – 14 133,445 (5.13%)
15 – 19 101,971 (3.92%)
20 – 24 224,612 (8.64%)
25 – 29 422,946 (16.27%)
30 – 34 498,260 (19.16%)
35 – 39 486,912 (18.73%)
40 – 44 364,098 (14.00%)
45 – 49 226,389 (8.71%)
50 – 54 142,183 (5.47%)
55 – 59 80,000 (3.08%)
60 – 64 42,268 (1.63%)
65 – 69 21,250 (0.82%)
70 – 74 10,286 (0.40%)
75 – 79 6,379 (0.25%)
80+ 3,683 (0.14%)
Qatar’s population pyramid reveals a distinctly unbalanced structure, heavily concentrated in the 25–39 age group, which together accounts for over 54% of the total population. This reflects the country’s dependency on foreign labor, particularly male expatriates employed in construction, infrastructure, and services. The 30–34 age bracket is the largest, comprising 19.16%, underscoring the prime working-age influx.
Conversely, children (0–14 years) and elderly (60+ years) collectively make up a small fraction, together accounting for less than 15% of the population, which indicates low fertility among nationals and minimal elderly presence, again highlighting the transient nature of the expat workforce.
Conclusion:
Qatar’s economy demonstrates resilience, adaptability, and potential — but also continued reliance on hydrocarbons. The country is progressing toward diversification and Vision 2030 goals, but there’s room for growth in knowledge-based industries, tourism, and technology. To stay ahead of trends, mitigate risk, and capitalize on opportunity, partner with Optimena for tailored market research on Qatar and the GCC. Whether you’re an investor, policymaker, or entrepreneur, we deliver the insights that drive confident decision-making.


