Overview:
Kuwait presents a dynamic economic landscape characterized by significant oil dependency, evolving fiscal policies, and unique demographic patterns. This comprehensive analysis examines Kuwait’s economic and demographic indicators from 2011 through 2025, revealing both notable strengths and persistent challenges. As Kuwait navigates global market pressures and pursues economic diversification initiatives, understanding these key metrics provides valuable insights for investors, policymakers, and businesses operating in the region.
The data reveals Kuwait’s economic resilience despite substantial volatility in GDP growth, largely driven by global oil price fluctuations. With hydrocarbons accounting for over 40% of GDP and driving export performance, Kuwait maintains strong trade surpluses and substantial foreign exchange reserves. Meanwhile, the country’s demographic profile shows a working-age population heavily skewed toward the 30-44 age bracket, reflecting its significant reliance on expatriate labor while presenting distinct opportunities and challenges for sustainable growth.
Kuwait Gross domestic product (GDP) 2011-2024 (Billion $) :
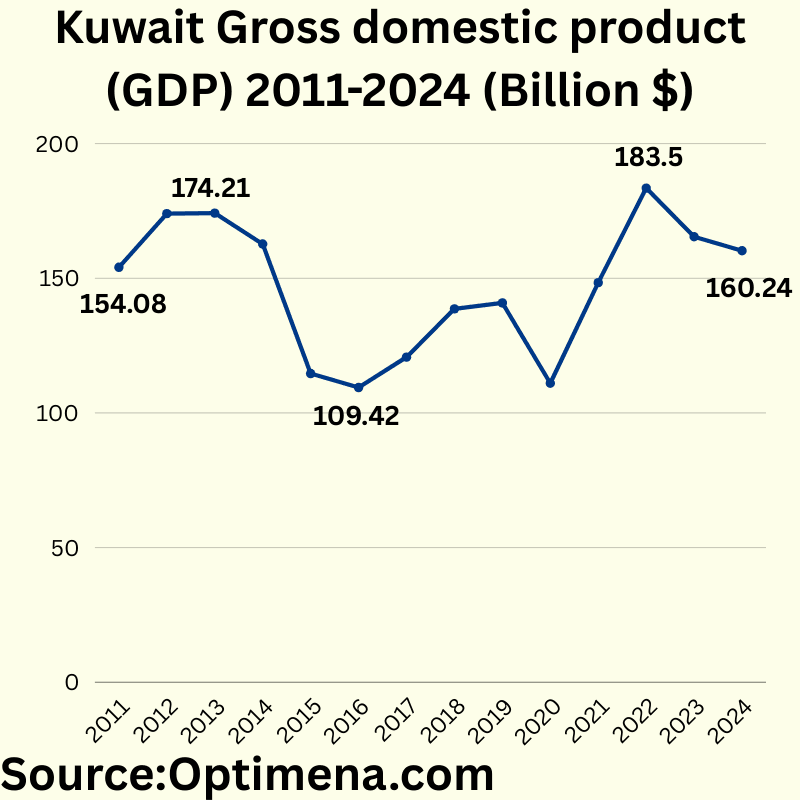
2011 $154.08 Billion
2012 $174.00 Billion
2013 $174.21 Billion
2014 $162.73 Billion
2015 $114.62 Billion
2016 $109.42 Billion
2017 $120.72 Billion
2018 $138.65 Billion
2019 $140.85 Billion
2020 $111.03 Billion
2021 $148.39 Billion
2022 $183,5 Billion
2023 $165.42 Billion
2024 $160.24 Billion
Kuwait’s GDP demonstrates significant volatility over this period, strongly reflecting oil price fluctuations. There was a sharp decline in 2015-2016 (about 34% from peak) coinciding with the global oil price crash. The economy rebounded through 2017-2019, then contracted during the COVID-19 pandemic in 2020 (21% decline), before experiencing strong recovery to reach an all-time high in 2022 at $183.5 billion. Since then, there’s been a moderate decline of about 13% through 2024, suggesting economic diversification challenges as oil prices stabilized at lower levels than the 2022 peak.
Contribution of economic activities to Kuwait GDP:
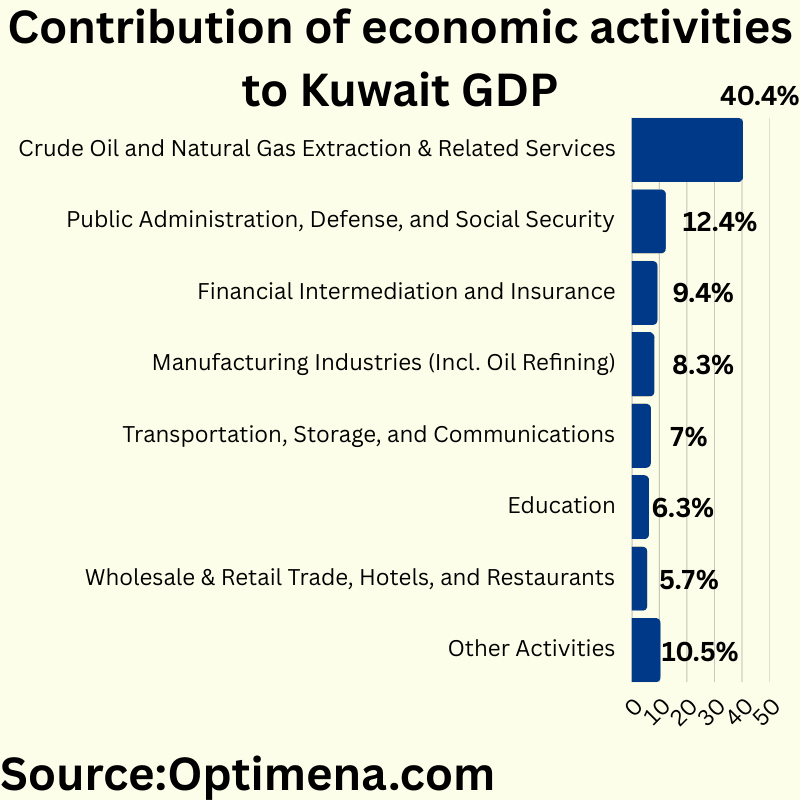
Crude Oil and Natural Gas Extraction & Related Services (40.4%)
Public Administration, Defense, and Social Security (12.4%)
Financial Intermediation and Insurance (9.4%)
Manufacturing Industries (Incl. Oil Refining) (8.3%)
Transportation, Storage, and Communications (7.0%)
Education (6.3%)
Wholesale & Retail Trade, Hotels, and Restaurants (5.7%)
Other Activities (10.5%)
Kuwait’s economy remains heavily oil-dependent with the hydrocarbon sector directly accounting for over 40% of GDP. Government sectors (public administration and education) contribute nearly 19%, highlighting the state’s significant economic role. Financial services represent the third-largest sector at 9.4%, indicating some success in economic diversification efforts. The relatively small contribution of wholesale & retail trade, hotels, and restaurants (5.7%) suggests limited development in consumer-facing and tourism sectors compared to other Gulf economies pursuing similar diversification strategies.
Kuwait Consumer Price Index (CPI) 2018-2025:
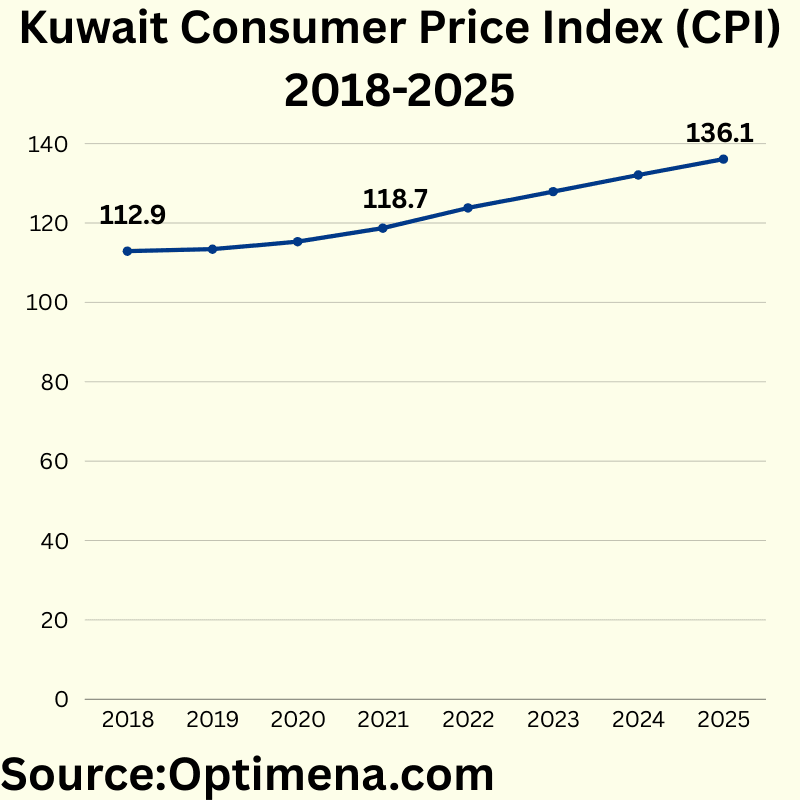
2018 112.9
2019 113.4
2020 115.3
2021 118.7
2022 123.8
2023 127.9
2024 132.1
2025 136.1
Kuwait’s CPI shows a consistent upward trend, with inflation accelerating in recent years. From 2018-2019, inflation was minimal at 0.4%, but annual increases grew to 1.7% in 2020, 2.9% in 2021, and peaking at 4.3% in 2022, likely reflecting global inflationary pressures following pandemic-related supply chain disruptions and monetary stimulus. The inflation rate has maintained at around 3.3-3.7% annually from 2023-2025, suggesting persistent inflationary pressures despite global efforts to control inflation. This moderate but sustained inflation rate could impact purchasing power if not matched by wage growth.
Kuwait Trade Balance 2017-2024 (Billion $):
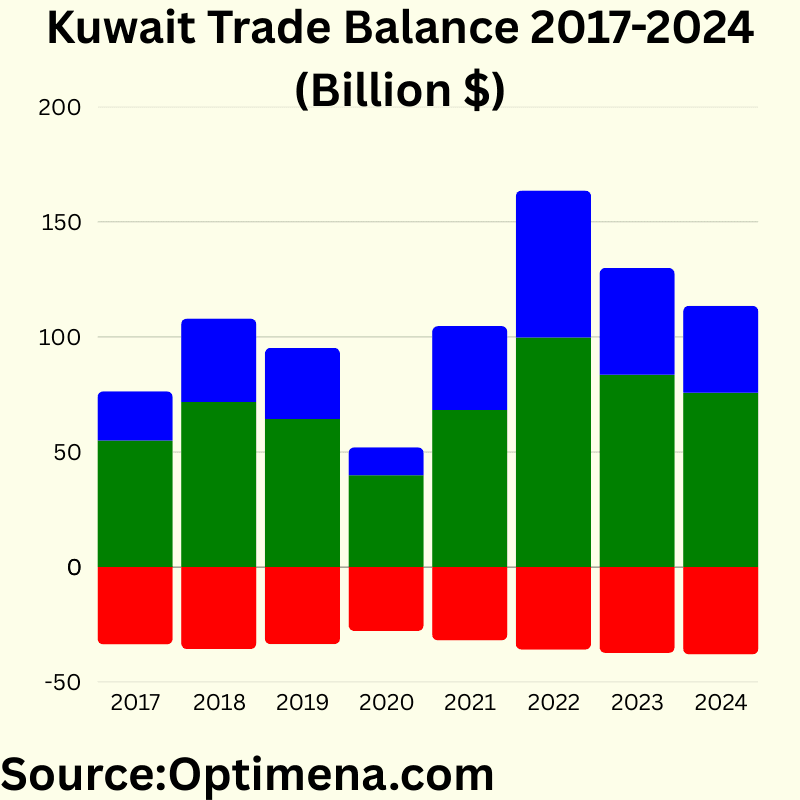
2017:
Imports: $33.568 Billion
Exports: $54.978 Billion
Trade Balance: $21.410 Billion
2018:
Imports: $35.585 Billion
Exports: $71.773 Billion
Trade Balance: $36.188 Billion
2019:
Imports: $33.478 Billion
Exports: $64.358 Billion
Trade Balance: $30.880 Billion
2020:
Imports: $27.781 Billion
Exports: $39.935 Billion
Trade Balance: $12.154 Billion
2021
Imports: $31.879 Billion
Exports: $68.292 Billion
Trade Balance: $36.413 Billion
2022
Imports: $35.943 Billion
Exports: $99.791 Billion
Trade Balance: $63.848 Billion
2023
Imports: $37.273 Billion
Exports: $83.614 Billion
Trade Balance: $46.341 Billion
2024
Imports: $37.983 Billion
Exports: $75.748 Billion
Trade Balance: $37.765 Billion
Kuwait consistently maintains a strong trade surplus, primarily driven by oil exports. The trade balance dramatically reflects oil price cycles, with the surplus nearly doubling from 2017 to 2018, then collapsing by 70% in 2020 during pandemic-related demand disruption. The 2022 surplus reached an extraordinary $63.8 billion (426% higher than 2020) due to post-pandemic oil price surge. Import values have shown relative stability (ranging from $27.8-38.0 billion), while exports fluctuate dramatically ($39.9-99.8 billion), highlighting Kuwait’s continued economic vulnerability to global oil market conditions.
Kuwait Interest rates 2011-2025:
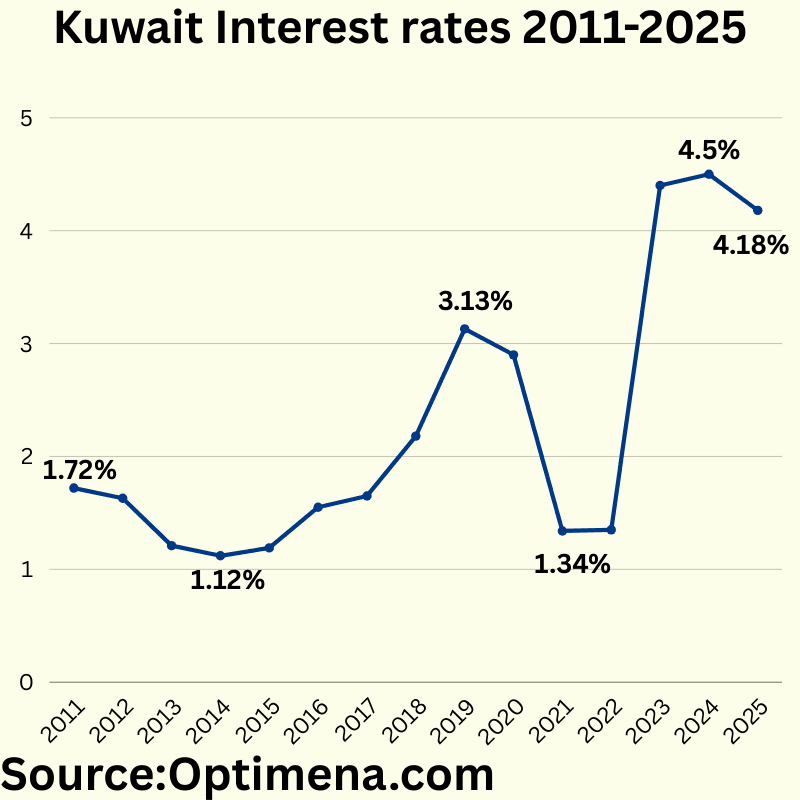
2011 1.72%
2012 1.63%
2013 1.21%
2014 1.12%
2015 1.19%
2016 1.55%
2017 1.65%
2018 2.18%
2019 3.13%
2020 2.90%
2021 1.34%
2022 1.35%
2023 4.4%
2024 4.5%
2025 4.18%
Kuwait’s interest rates reflect both domestic economic conditions and global monetary policy trends. Rates declined to historic lows (1.12-1.19%) during 2014-2015, coinciding with the oil price crash. A gradual rise occurred through 2018-2019, reaching 3.13% as the economy stabilized. The COVID-19 pandemic prompted aggressive rate cuts in 2021 to 1.34% to stimulate economic activity.
The most dramatic shift came in 2023, with rates more than tripling to 4.4% to combat inflation, aligning with global central bank tightening. The slight decrease projected for 2025 suggests anticipation of moderating inflation pressures, though rates remain significantly higher than the 2011-2022 period.
Kuwait Foreign Exchange Reserves 2017-2025 (billion $):

2017 $31.18 Billion
2018 $34.89 Billion
2019 $37.30 Billion
2020 $38.13 Billion
2021 $44.52 Billion
2022 $40.21 Billion
2023 $46.77 Billion
2024 $41.33 Billion
2025 $40.29 Billion
Kuwait’s foreign exchange reserves show a generally positive trajectory from 2017-2023, with significant fluctuations in recent years. Reserves increased by 50% from 2017 to 2023, reaching a peak of $46.77 billion, demonstrating strong external buffers during periods of oil price volatility. However, the 12% decline from 2023 to 2025 suggests increasing fiscal pressures, possibly due to expanded government spending, lower oil revenues, or strategic policy decisions. Despite recent declines, reserves remain substantially higher than 2017 levels, providing Kuwait with significant economic resilience against external shocks compared to many regional peers.
Kuwait Demographic Outlook:
Kuwait population 2012-2025 (Millions) :
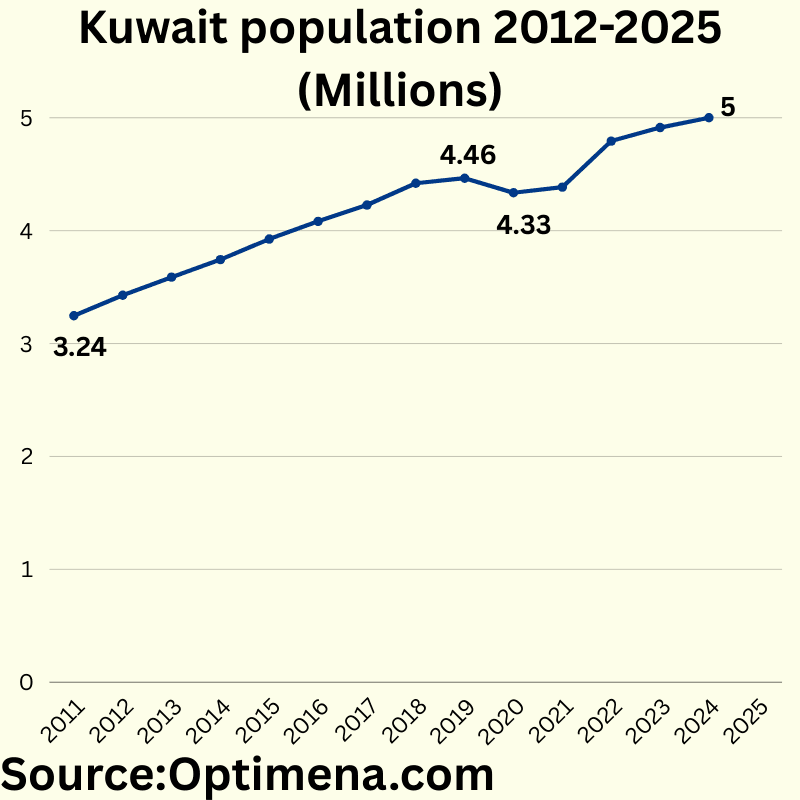
2012 3246622
2013 3427595
2014 3588092
2015 3743660
2016 3925487
2017 4082704
2018 4226920
2019 4420110
2020 4464521
2021 4336012
2022 4385717
2023 4793568
2024 4913271
2025 5000000
Kuwait’s population has grown by approximately 54% from 2012 to 2025, reaching the 5 million milestone. Growth was steady until 2019, averaging 4.5% annually, before stalling during the COVID-19 pandemic. Most notably, there was a population decrease in 2021 (-2.9%), likely reflecting expatriate workers leaving during pandemic restrictions. Post-pandemic recovery has been robust, with especially strong growth in 2023 (9.3% increase), suggesting a significant influx of foreign workers returning to Kuwait. The growth rate has moderated in 2024-2025, indicating stabilization toward more sustainable long-term population expansion.
Kuwait population pyramid (age distribution) :
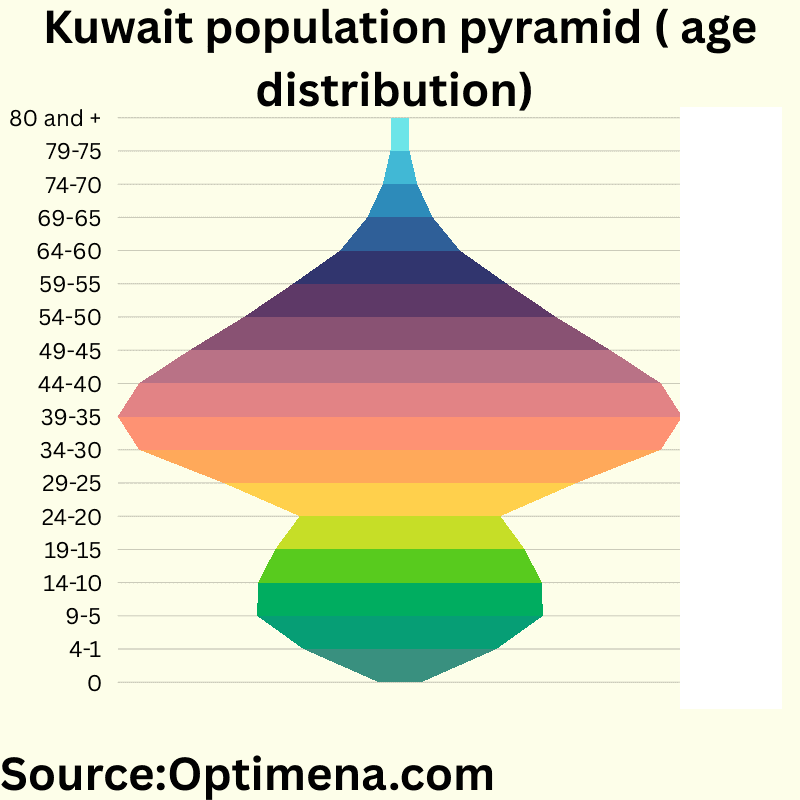
0 47919 (0.97%)
1-4 214671 (4.37%)
5-9 317846 (6.47%)
10-14 314918 (6.41%)
15-19 277934 (5.65%)
20-24 223196 (4.54%)
25-29 392156 (7.98%)
30-34 579969 (11.80%)
35-39 627456 (12.77%)
40-44 580284 (11.81%)
45-49 467582 (9.52%)
50-54 346803 (7.06%)
55-59 237594 (4.84%)
60-64 133214 (2.71%)
65-69 72736 (1.48%)
70-74 38434 (0.78%)
75-79 21281 (0.43%)
80 and + 19278 (0.39%)
Kuwait’s population pyramid reflects its unique demographic structure as a Gulf state with significant expatriate labor force. The distribution is heavily concentrated in working-age brackets, with over 60% of the population between 25-54 years old. The bulge in the 30-44 age range (36.4% of total population) indicates substantial imported labor. The relatively small proportion of elderly (only 3.1% aged 65+) suggests limited aging pressures on social services. The narrow base (children 0-4 comprise just 5.3%) compared to school-age children indicates declining birth rates. This working-age heavy structure presents both opportunities for economic productivity and challenges for long-term demographic sustainability.
Conclusion:
Kuwait’s economic and demographic data paint a picture of a nation at a crossroads. While maintaining considerable economic strength through its hydrocarbon resources, the country faces clear imperatives for diversification. The volatile GDP trajectory, heavily influenced by global oil markets, underscores this need, even as the financial services sector (9.4% of GDP) shows promising signs of expansion beyond traditional energy industries.
The demographic structure, with its concentration of working-age expatriates and relatively small proportion of elderly citizens, provides Kuwait with a productive workforce but raises questions about long-term population sustainability. Recent population fluctuations, particularly during and after the COVID-19 pandemic, highlight the interconnection between economic conditions and demographic patterns in Kuwait’s development story.
Looking forward, Kuwait’s economic resilience will likely depend on successfully balancing its historical strengths in energy production with meaningful progress in diversification initiatives. Simultaneously, demographic planning must address both current workforce needs and long-term population sustainability in a rapidly changing global environment.
For comprehensive market research services and detailed reports , please contact Optimena. Our specialized research team delivers actionable insights and data-driven analysis to support your strategic decision-making throughout the region.


